![]()
![]()
![]()


Gatus 是一个面向开发者的健康监控仪表盘,允许您使用 HTTP、ICMP、TCP 甚至 DNS 查询来监控您的服务, 并通过对状态码、响应时间、证书过期时间、响应体等多个值列表的条件进行评估来判断查询结果。 最棒的是,每个健康检查都可以配合 Slack、Teams、PagerDuty、Discord、Twilio 等多种方式进行告警。
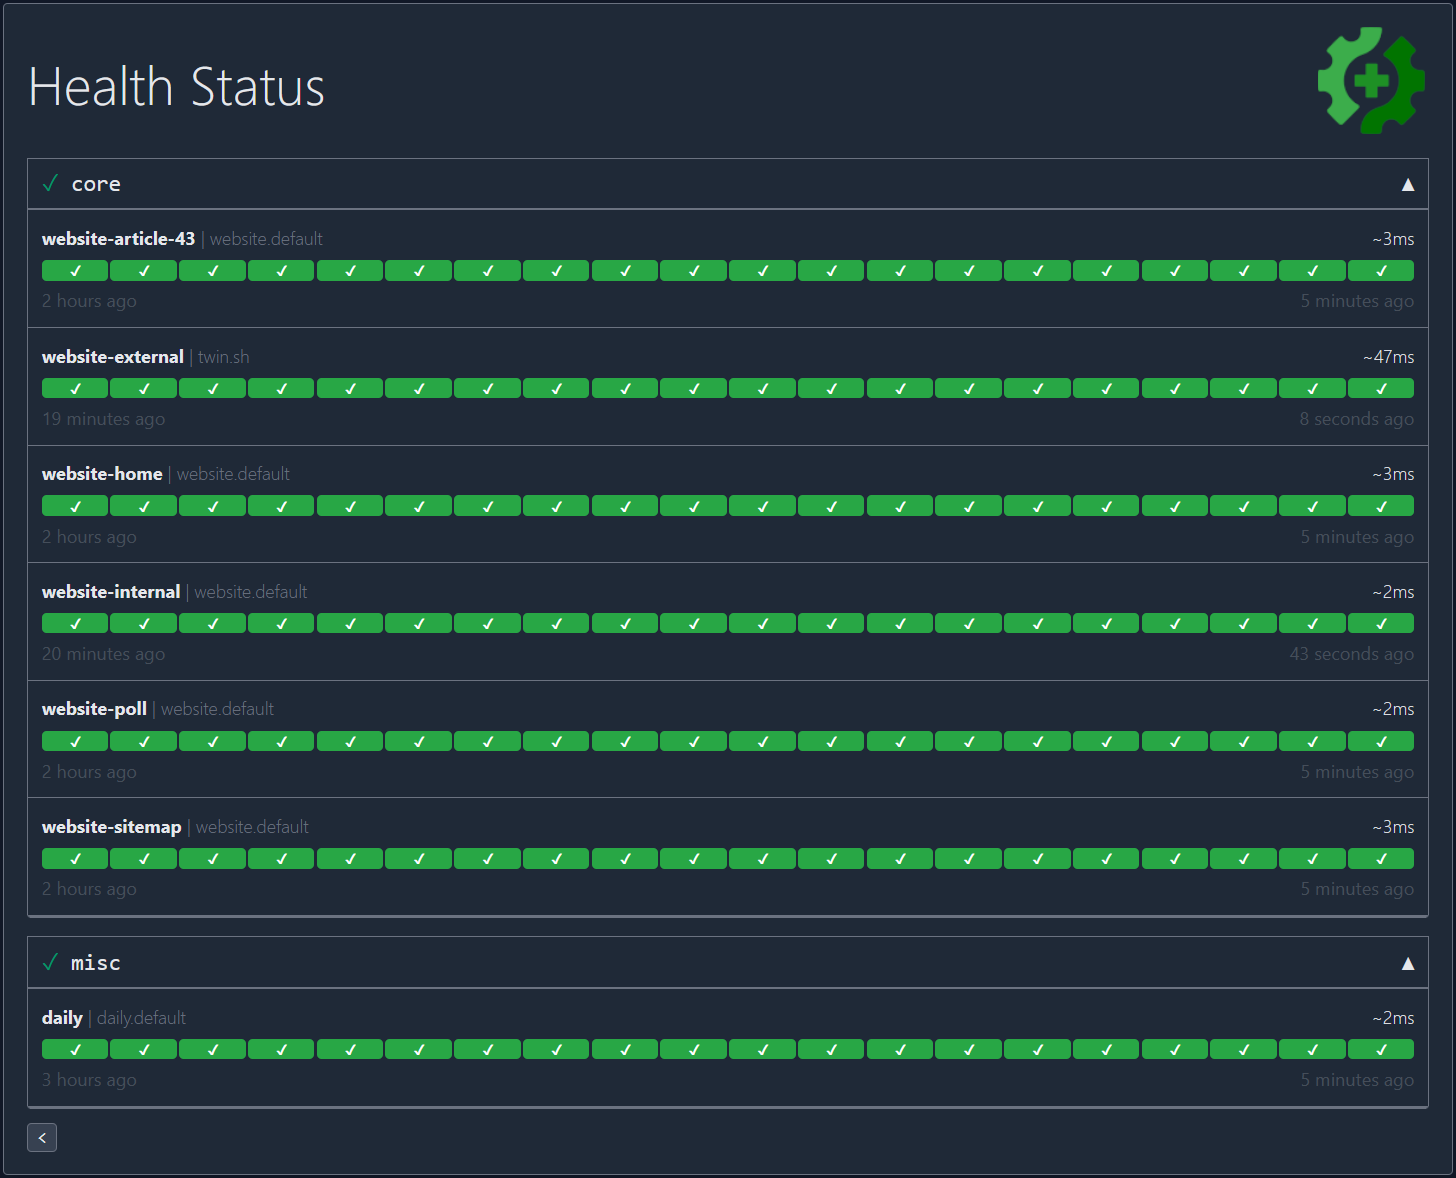
我个人将它部署在我的 Kubernetes 集群中,监控我的核心应用状态:https://status.twin.sh/
_想找托管解决方案?请查看 Gatus.io。_
快速开始
docker run -p 8080:8080 --name gatus twinproduction/gatus:stabledocker run -p 8080:8080 --name gatus ghcr.io/twin/gatus:stable❤ 喜欢这个项目吗?请考虑 赞助我。
有任何反馈或问题?创建讨论。
目录
- 目录
- 为什么选择 Gatus?
- 功能
- 使用
- 配置
- 端点
- 外部端点
- 条件
- 占位符
- 函数
- 存储
- 客户端配置
- 告警
- 配置 AWS SES 告警
- 配置 Discord 告警
- 配置电子邮件告警
- 配置 Gitea 告警
- 配置 GitHub 告警
- 配置 GitLab 告警
- 配置 Google Chat 告警
- 配置 Gotify 告警
- 配置 HomeAssistant 告警
- 配置 Ilert 告警
- 配置 Incident.io 告警
- 配置 JetBrains Space 告警
- 配置 Matrix 告警
- 配置 Mattermost 告警
- 配置 Messagebird 告警
- 配置 Ntfy 告警
- 配置 Opsgenie 告警
- 配置 PagerDuty 告警
- 配置 Pushover 告警
- 配置 Slack 告警
- 配置 Teams 告警 (已弃用)
- 配置 Teams 工作流告警
- 配置 Telegram 告警
- 配置 Twilio 告警
- 配置 Zulip 告警
- 配置自定义告警
- 设置默认告警
- 维护
- 安全
- 基本认证
- OIDC
- TLS 加密
- 指标
- 连接性
- 远程实例(实验性)
- 部署
- Docker
- Helm Chart
- Terraform
- 运行测试
- 生产环境使用
- 常见问题
- 发送 GraphQL 请求
- 推荐间隔
- 默认超时
- 监控 TCP 端点
- 监控 UDP 端点
- 监控 SCTP 端点
- 监控 WebSocket 端点
- 使用 ICMP 监控端点
- 使用 DNS 查询监控端点
- 使用 SSH 监控端点
- 使用 STARTTLS 监控端点
- 使用 TLS 监控端点
- 监控域名过期
- 禁用监控锁
- 动态重新加载配置
- 端点分组
- 自定义路径暴露 Gatus
- 自定义端口暴露 Gatus
- 配置启动延迟
- 保持配置简洁
- 代理客户端配置
- 如何修复 431 请求头字段过大错误
- 徽章
- 正常运行时间
- 健康状态
- 健康状态(Shields.io)
- 响应时间
- 响应时间(图表)
- 如何更改响应时间徽章的颜色阈值
- API
- 原始数据
- 正常运行时间
- 响应时间
- 安装为二进制文件
- 高级设计概览
为什么选择 Gatus?
在进入具体细节之前,我想先回答最常见的问题:当我可以使用 Prometheus 的 Alertmanager、Cloudwatch 甚至 Splunk 时,为什么还要用 Gatus?
如果没有客户端主动调用端点,这些工具都无法告诉你存在问题。 换句话说,因为监控指标大多依赖于现有流量,这实际上意味着除非 你的客户端已经遇到问题,否则你不会收到通知。
另一方面,Gatus 允许你为每个功能配置健康检查,这反过来使它能够 监控这些功能,并可能在任何客户端受到影响之前提醒你。
你可能需要考虑使用 Gatus 的一个标志是,问问自己如果你的负载均衡器 现在故障,你会收到警报吗?你现有的警报会被触发吗?如果没有流量到达你的应用, 你的指标不会报告错误增加。这使你处于一种情况:是你的客户通知你服务退化, 而不是你在他们知道问题之前就向他们保证你正在修复问题。
功能
Gatus 的主要功能有:- 高度灵活的健康检查条件:虽然检查响应状态可能对某些用例已足够,Gatus 走得更远,允许你对响应时间、响应体甚至 IP 地址添加条件。
- 可用于用户验收测试:得益于上述功能,你可以利用此应用创建自动化的用户验收测试。
- 配置非常简单:配置不仅设计得尽可能易读,添加新的服务或新的监控端点也极其简单。
- 告警功能:虽然一个美观的仪表盘有助于跟踪应用状态,但你可能不想整天盯着它看。因此,Gatus 开箱即支持通过 Slack、Mattermost、Messagebird、PagerDuty、Twilio、Google Chat 和 Teams 发送通知,并且支持配置自定义告警提供者,以满足你可能有的任何需求,无论是不同的提供者还是管理自动回滚的自定义应用。
- 指标
- 低资源消耗:和大多数 Go 应用一样,此应用所需的资源占用极小。
- 徽章:


- 暗黑模式
使用方法
快速开始
docker run -p 8080:8080 --name gatus twinproduction/gatusdocker run -p 8080:8080 --name gatus ghcr.io/twin/gatus如果您想创建自己的配置,请参阅 Docker 了解如何挂载配置文件的信息。
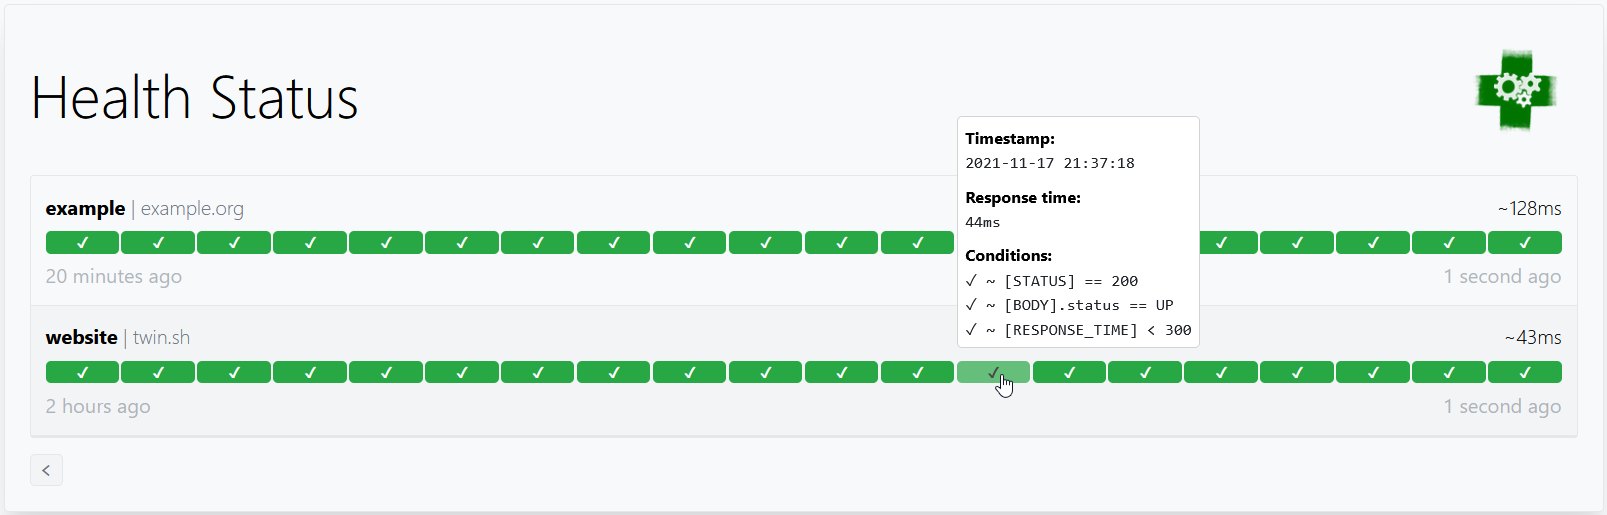
这是一个简单的示例:
endpoints:
- name: website # Name of your endpoint, can be anything
url: "https://twin.sh/health"
interval: 5m # Duration to wait between every status check (default: 60s)
conditions:
- "[STATUS] == 200" # Status must be 200
- "[BODY].status == UP" # The json path "$.status" must be equal to UP
- "[RESPONSE_TIME] < 300" # Response time must be under 300ms
- name: make-sure-header-is-rendered
url: "https://example.org/"
interval: 60s
conditions:
- "[STATUS] == 200" # Status must be 200
- "[BODY] == pat(
Example Domain
)" # Body must contain the specified header
默认情况下,配置文件预期位于 config/config.yaml。
您可以通过设置 GATUS_CONFIG_PATH 环境变量来指定自定义路径。
如果 GATUS_CONFIG_PATH 指向一个目录,则该目录及其子目录内的所有 .yaml 和 .yml 文件将被合并,规则如下:
- 所有映射/对象都会进行深度合并(即您可以在一个文件中定义
alerting.slack,在另一个文件中定义alerting.pagerduty) - 所有切片/数组都会被追加(即您可以在多个文件中定义
endpoints,每个端点都会被添加到最终的端点列表中) - 具有原始值的参数(例如
metrics、alerting.slack.webhook-url等)只能定义一次,以强制避免任何歧义 - 具体来说,这也意味着您不能在两个文件中以不同的值定义
alerting.slack.webhook-url。所有文件在处理前都会合并成一个文件。这是设计使然。
$DOMAIN、${DOMAIN})
>
请参见 examples/docker-compose-postgres-storage/config/config.yaml 作为示例。
如果您想在本地测试,请参见 Docker。
配置
| 参数 | 描述 | 默认值 | |:-----------------------------|:----------------------------------------------------------------------------------------------------------------------------------|:----------------------------| |metrics | 是否在 /metrics 公开指标。 | false |
| storage | 存储配置。 | {} |
| alerting | 告警配置。 | {} |
| endpoints | 端点配置。 | 必填 [] |
| external-endpoints | 外部端点配置。 | [] |
| security | 安全配置。 | {} |
| disable-monitoring-lock | 是否禁用监控锁。 | false |
| skip-invalid-config-update | 是否忽略无效的配置更新。请参见动态重载配置。 |
false |
| web | Web 配置。 | {} |
| web.address | 监听地址。 | 0.0.0.0 |
| web.port | 监听端口。 | 8080 |
| web.read-buffer-size | 读取连接请求的缓冲区大小。也是最大头部大小的限制。 | 8192 |
| web.tls.certificate-file | TLS 的可选公钥证书文件,PEM 格式。 | ` |
| web.tls.private-key-file | TLS 的可选私钥文件,PEM 格式。 | |
| ui | UI 配置。 | {} |
| ui.title | 文档标题。 | Health Dashboard ǀ Gatus |
| ui.description | 页面元描述。 | Gatus is an advanced.... |
| ui.header | 仪表盘顶部的标题。 | Health Status |
| ui.logo | 显示的 logo 的 URL。 | "" |
| ui.link | 点击 logo 时打开的链接。 | "" |
| ui.buttons | 显示在标题下方的按钮列表。 | [] |
| ui.buttons[].name | 按钮上显示的文本。 | 必填 "" |
| ui.buttons[].link | 点击按钮时打开的链接。 | 必填 "" |
| ui.custom-css | 自定义 CSS。 | "" |
| ui.dark-mode | 是否默认启用暗模式。注意这会被用户操作系统主题偏好覆盖。 | true |
| maintenance | 维护配置。 | {} |如果您想要更详细的日志,可以将
GATUS_LOG_LEVEL 环境变量设置为 DEBUG。
相反,如果您想要更少的日志详细度,可以将上述环境变量设置为 WARN、ERROR 或 FATAL。
GATUS_LOG_LEVEL 的默认值是 INFO。端点
端点是您想要监控的 URL、应用或服务。每个端点都有一组条件,这些条件会在您定义的间隔内进行评估。如果有任何条件失败,端点即被视为不健康。
然后您可以配置告警,在端点不健康达到某个阈值时触发告警。| 参数 | 描述 | 默认值 |
|:--------------------------------------------|:----------------------------------------------------------------------------------------------------------------------------------------|:----------------------------|
|
endpoints | 要监控的端点列表。 | 必填 [] |
| endpoints[].enabled | 是否监控该端点。 | true |
| endpoints[].name | 端点名称。可以是任意内容。 | 必填 "" |
| endpoints[].group | 分组名称。用于在仪表盘上将多个端点分组。
请参见端点分组。 | "" |
| endpoints[].url | 发送请求的 URL。 | 必填 "" |
| endpoints[].method | 请求方法。 | GET |
| endpoints[].conditions | 用于确定端点健康状况的条件。
请参见条件。 | [] |
| endpoints[].interval | 每次状态检查之间等待的时长。 | 60s |
| endpoints[].graphql | 是否将请求体包装在查询参数中({"query":"$body"})。 | false |
| endpoints[].body | 请求体。 | "" |
| endpoints[].headers | 请求头。 | {} |
| endpoints[].dns | DNS 类型端点的配置。
请参见使用 DNS 查询监控端点。 | "" |
| endpoints[].dns.query-type | 查询类型(例如 MX)。 | "" |
| endpoints[].dns.query-name | 查询名称(例如 example.com)。 | "" |
| endpoints[].ssh | SSH 类型端点的配置。
请参见使用 SSH 监控端点。 | "" |
| endpoints[].ssh.username | SSH 用户名(例如 example)。 | 必填 "" |
| endpoints[].ssh.password | SSH 密码(例如 password)。 | 必填 "" |
| endpoints[].alerts | 给定端点的所有告警列表。
请参见告警。 | [] |
| endpoints[].maintenance-windows | 给定端点的所有维护时间窗口列表。
请参见维护。 | [] |
| endpoints[].client | 客户端配置。 | {} |
| endpoints[].ui | 端点级别的 UI 配置。 | {} |
| endpoints[].ui.hide-conditions | 是否从结果中隐藏条件。注意这只隐藏从启用该项时起评估的结果中的条件。 | false |
| endpoints[].ui.hide-hostname | 是否从结果中隐藏主机名。 | false |
| endpoints[].ui.hide-port | 是否从结果中隐藏端口。 | false |
| endpoints[].ui.hide-url | 是否从结果中隐藏 URL。如果 URL 包含令牌,这很有用。 | false |
| endpoints[].ui.dont-resolve-failed-conditions | 是否为 UI 解析失败的条件。 | false |
| endpoints[].ui.badge.response-time | 响应时间阈值列表。每当达到一个阈值,徽章颜色不同。 | [50, 200, 300, 500, 750] |您可以在请求体(
endpoints[].body)中使用以下占位符:
[ENDPOINT_NAME](解析自 endpoints[].name)
[ENDPOINT_GROUP](解析自 endpoints[].group)
[ENDPOINT_URL](解析自 endpoints[].url)
[LOCAL_ADDRESS](解析为本地 IP 和端口,如 192.0.2.1:25 或 [2001:db8::1]:80)
[RANDOM_STRING_N](解析为长度为 N 的随机数字字母字符串)外部端点
与常规端点不同,外部端点不由 Gatus 监控,而是通过编程方式推送。
这允许您监控任何您想要的内容,即使您想检查的内容位于 Gatus 通常无法访问的环境中。例如:
- 您可以创建一个位于私有网络中的代理,将服务状态推送到公开暴露的 Gatus 实例
- 您可以监控 Gatus 不支持的服务
- 您可以实现自己的监控系统,同时使用 Gatus 作为仪表板
| 参数 | 说明 | 默认值 |
|:------------------------------|:-------------------------------------------------------------------------------------------------------------------------|:-------------|
| external-endpoints | 需要监控的端点列表。 | [] |
| external-endpoints[].enabled | 是否监控该端点。 | true |
| external-endpoints[].name | 端点名称。可以是任何内容。 | 必填 "" |
| external-endpoints[].group | 分组名称。用于在仪表板上将多个端点分组显示。
参见 端点分组。 | "" |
| external-endpoints[].token | 推送状态所需的 Bearer 令牌。 | 必填 "" |
| external-endpoints[].alerts | 给定端点的所有警报列表。
参见 警报。 | [] |示例:
external-endpoints:
- name: ext-ep-test
group: core
token: "potato"
alerts:
- type: discord
description: "healthcheck failed"
send-on-resolved: true
将外部端点的状态推送, 请求必须如下所示:POST /api/v1/endpoints/{key}/external?success={success}&error={error}&duration={duration}
Where:
{key} 的格式是 ,其中两个变量中的 、/、_、,、. 和 # 都被替换为 -。
使用上面示例配置,key 会是 core_ext-ep-test。
{success} 是一个布尔值(true 或 false),表示健康检查是否成功。
{error}(可选):描述健康检查失败原因的字符串。如果 {success} 为 false,则应包含错误信息;如果检查成功,则不包含。
{duration}(可选):请求所用时间,格式为持续时间字符串(例如 10s)。你还必须将令牌作为
Bearer 令牌通过 Authorization 头传递。条件
以下是一些你可以使用的条件示例:| 条件 | 描述 | 通过的值 | 失败的值 |
|:---------------------------------|:---------------------------------------------------|:--------------------------|-----------------|
|
[STATUS] == 200 | 状态必须等于 200 | 200 | 201,404,... |
| [STATUS] < 300 | 状态必须小于 300 | 200,201,299 | 301,302,... |
| [STATUS] <= 299 | 状态必须小于或等于 299 | 200,201,299 | 301,302,... |
| [STATUS] > 400 | 状态必须大于 400 | 401,402,403,404 | 400,200,... |
| [STATUS] == any(200, 429) | 状态必须是 200 或 429 | 200,429 | 201,400,... |
| [CONNECTED] == true | 与主机的连接必须成功 | true | false |
| [RESPONSE_TIME] < 500 | 响应时间必须低于 500 毫秒 | 100ms,200ms,300ms | 500ms,501ms |
| [IP] == 127.0.0.1 | 目标 IP 必须是 127.0.0.1 | 127.0.0.1 | 0.0.0.0 |
| [BODY] == 1 | 响应体必须等于 1 | 1 | {},2,... |
| [BODY].user.name == john | JSONPath 值 $.user.name 等于 john | {"user":{"name":"john"}}| |
| [BODY].data[0].id == 1 | JSONPath 值 $.data[0].id 等于 1 | {"data":[{"id":1}]} | |
| [BODY].age == [BODY].id | JSONPath 值 $.age 等于 JSONPath $.id | {"age":1,"id":1} | |
| len([BODY].data) < 5 | JSONPath $.data 的数组长度小于 5 | {"data":[{"id":1}]} | |
| len([BODY].name) == 8 | JSONPath $.name 的字符串长度为 8 | {"name":"john.doe"} | {"name":"bob"}|
| has([BODY].errors) == false | JSONPath $.errors 不存在 | {"name":"john.doe"} | {"errors":[]} |
| has([BODY].users) == true | JSONPath $.users 存在 | {"users":[]} | {} |
| [BODY].name == pat(john) | JSONPath $.name 的字符串匹配模式 john | {"name":"john.doe"} | {"name":"bob"}|
| [BODY].id == any(1, 2) | JSONPath $.id 的值等于 1 或 2 | 1,2 | 3,4,5 |
| [CERTIFICATE_EXPIRATION] > 48h | 证书过期时间距离现在超过 48 小时 | 49h,50h,123h | 1h,24h,... |
| [DOMAIN_EXPIRATION] > 720h | 域名过期时间距离现在超过 720 小时 | 4000h | 1h,24h,... |
#### 占位符
| 占位符 | 描述 | 解析后的示例值 |
|:----------------------------|:--------------------------------------------------------------------------------------|:-----------------------------------|
|
[STATUS] | 解析为请求的 HTTP 状态码 | 404 |
| [RESPONSE_TIME] | 解析为请求响应时间,单位为毫秒 | 10 |
| [IP] | 解析为目标主机的 IP | 192.168.0.232 |
| [BODY] | 解析为响应体,支持 JSONPath | {"name":"john.doe"} |
| [CONNECTED] | 解析为是否成功建立连接 | true |
| [CERTIFICATE_EXPIRATION] | 解析为证书过期前的持续时间(有效单位为 "s"、"m"、"h") | 24h,48h,0(如果协议无证书) |
| [DOMAIN_EXPIRATION] | 解析为域名过期前的持续时间(有效单位为 "s"、"m"、"h") | 24h,48h,1234h56m78s |
| [DNS_RCODE] | 解析为 DNS 响应状态码 | NOERROR |
#### 函数
| 函数 | 描述 | 示例 |
|:---------|:-----------------------------------------------------------------------------------------------------------------------------------------------------------------------------------------------------------------------------|:---------------------------------|
|
len | 如果给定路径对应数组,则返回其长度。否则,给定路径的 JSON 会被压缩转为字符串,返回字符数。仅适用于 [BODY] 占位符。 | len([BODY].username) > 8 |
| has | 判断给定路径是否有效,返回 true 或 false。仅适用于 [BODY] 占位符。 | has([BODY].errors) == false |
| pat | 指定传入的字符串参数应作为模式进行匹配。仅适用于 == 和 !=。 | [IP] == pat(192.168.*) |
| any | 指定多个参数中任意一个为有效值。仅适用于 == 和 !=。 | [BODY].ip == any(127.0.0.1, ::1)|💡 仅在必要时使用
pat。[STATUS] == pat(2*) 比 [STATUS] < 300 的性能开销要大得多。存储
| 参数 | 描述 | 默认值 |
|:---------------------------------|:--------------------------------------------------------------------------------------|:----------------|
| storage | 存储配置 | {} |
| storage.path | 持久化数据路径。仅支持 sqlite 和 postgres 类型。 | "" |
| storage.type | 存储类型。有效类型:memory、sqlite、postgres。 | "memory" |
| storage.caching | 是否启用写穿缓存。改善大仪表盘的加载时间。
仅在 storage.type 为 sqlite 或 postgres 时支持。 | false |
| storage.maximum-number-of-results | 端点允许保存的最大结果数量 | 100 |
| storage.maximum-number-of-events | 端点允许保存的最大事件数量 | 50 |每个端点的健康检查结果以及正常运行时间和过去事件的数据必须持久化,
以便在仪表盘上显示。以上参数允许你配置相应的存储。
- 如果
storage.type 是 memory(默认):
# Note that this is the default value, and you can omit the storage configuration altogether to achieve the same result.
Because the data is stored in memory, the data will not survive a restart.
storage:
type: memory
maximum-number-of-results: 200
maximum-number-of-events: 5
- 如果
storage.type 是 sqlite,则 storage.path 不能为空:
storage:
type: sqlite
path: data.db
请参见 examples/docker-compose-sqlite-storage 获取示例。- 如果
storage.type 是 postgres,storage.path 必须是连接 URL:storage:
type: postgres
path: "postgres://user:password@127.0.0.1:5432/gatus?sslmode=disable"
参见examples/docker-compose-postgres-storage了解示例。客户端配置
为了支持各种环境,每个被监控的端点都有用于发送请求的客户端的唯一配置。| 参数 | 描述 | 默认值 |
|:---------------------------------------|:----------------------------------------------------------------------------|:----------------|
|
client.insecure | 是否跳过验证服务器的证书链和主机名。 | false |
| client.ignore-redirect | 是否忽略重定向(true)或跟随重定向(false,默认)。 | false |
| client.timeout | 超时前的持续时间。 | 10s |
| client.dns-resolver | 使用格式 {proto}://{host}:{port} 覆盖 DNS 解析器。 | "" |
| client.oauth2 | OAuth2 客户端配置。 | {} |
| client.oauth2.token-url | 令牌端点 URL。 | 必填 "" |
| client.oauth2.client-id | 用于“客户端凭据流”的客户端 ID。 | 必填 "" |
| client.oauth2.client-secret | 用于“客户端凭据流”的客户端密钥。 | 必填 "" |
| client.oauth2.scopes[] | 用于“客户端凭据流”的 scopes 列表。 | 必填 [""] |
| client.proxy-url | 客户端使用的代理 URL。 | "" |
| client.identity-aware-proxy | Google 身份感知代理客户端配置。 | {} |
| client.identity-aware-proxy.audience | 身份感知代理的受众。(IAP oauth2 凭据的客户端 ID) | 必填 "" |
| client.tls.certificate-file | mTLS 配置中客户端证书的路径(PEM 格式)。 | "" |
| client.tls.private-key-file | mTLS 配置中客户端私钥的路径(PEM 格式)。 | "" |
| client.tls.renegotiation | 提供的重新协商支持类型。(never,freely,once)。 | "never" |
| client.network | ICMP 端点客户端使用的网络(ip,ip4 或 ip6)。 | "ip" |📝 某些参数会根据端点类型被忽略。例如,ICMP 请求(ping)不涉及证书,因此将该类型端点的
client.insecure 设置为 true 不会产生任何作用。默认配置如下:
client:
insecure: false
ignore-redirect: false
timeout: 10s
请注意,此配置仅在 endpoints[]、alerting.mattermost 和 alerting.custom 下可用。以下是
endpoints[] 下客户端配置的示例:endpoints:
- name: website
url: "https://twin.sh/health"
client:
insecure: false
ignore-redirect: false
timeout: 10s
conditions:
- "[STATUS] == 200"
此示例展示了如何指定自定义 DNS 解析器:
endpoints:
- name: with-custom-dns-resolver
url: "https://your.health.api/health"
client:
dns-resolver: "tcp://8.8.8.8:53"
conditions:
- "[STATUS] == 200"
此示例展示了如何使用
client.oauth2 配置通过 Bearer token 查询后端 API:endpoints:
- name: with-custom-oauth2
url: "https://your.health.api/health"
client:
oauth2:
token-url: https://your-token-server/token
client-id: 00000000-0000-0000-0000-000000000000
client-secret: your-client-secret
scopes: ['https://your.health.api/.default']
conditions:
- "[STATUS] == 200"
此示例展示了如何使用
client.identity-aware-proxy 配置通过 Google 身份感知代理使用 Bearer token 查询后端 API:endpoints:
- name: with-custom-iap
url: "https://my.iap.protected.app/health"
client:
identity-aware-proxy:
audience: "XXXXXXXX-XXXXXXXXXXXX.apps.googleusercontent.com"
conditions:
- "[STATUS] == 200"
> 📝 请注意,Gatus 将在其环境中使用 gcloud 默认凭据 来生成令牌。
此示例向您展示如何使用
client.tls 配置对后端 API 执行 mTLS 查询:endpoints:
- name: website
url: "https://your.mtls.protected.app/health"
client:
tls:
certificate-file: /path/to/user_cert.pem
private-key-file: /path/to/user_key.pem
renegotiation: once
conditions:
- "[STATUS] == 200"
> 📝 请注意,如果在容器中运行,必须将证书和密钥以卷的形式挂载到容器中。警报
Gatus 支持多种警报提供商,如 Slack 和 PagerDuty,并支持为每个
独立端点配置不同的警报,包括可配置的描述和阈值。警报在端点级别配置,如下所示:
| 参数 | 描述 | 默认值 |
|:-----------------------------|:-------------------------------------------------------------------------------|:--------------|
|
alerts | 给定端点的所有警报列表。 | [] |
| alerts[].type | 警报类型。
所有有效类型请参见下表。 | 必填 "" |
| alerts[].enabled | 是否启用该警报。 | true |
| alerts[].failure-threshold | 触发警报前需要连续失败的次数。 | 3 |
| alerts[].success-threshold | 持续成功次数,达到后将正在进行的事件标记为已解决。 | 2 |
| alerts[].send-on-resolved | 当已触发的警报被标记为已解决时,是否发送通知。 | false |
| alerts[].description | 警报描述,将包含在发送的警报中。 | "" |
| alerts[].provider-override | 针对给定警报类型的警报提供商配置覆盖。 | {} |下面是端点级别警报配置的示例:
endpoints:
- name: example
url: "https://example.org"
conditions:
- "[STATUS] == 200"
alerts:
- type: slack
description: "healthcheck failed"
send-on-resolved: true
您也可以使用
alerts[].provider-override 来覆盖全局提供程序配置,如下所示:endpoints:
- name: example
url: "https://example.org"
conditions:
- "[STATUS] == 200"
alerts:
- type: slack
provider-override:
webhook-url: "https://hooks.slack.com/services///"
📝 如果警报提供程序未正确配置,所有使用该提供程序类型配置的警报将被忽略。
| 参数 | 描述 | 默认值 |
|:----------------------------|:-----------------------------------------------------------------------------------------------------------------------------------|:--------|
|
alerting.awsses | 类型为 awsses 的警报配置。
详见 配置 AWS SES 警报。 | {} |
| alerting.custom | 失败或警报时的自定义操作配置。
详见 配置自定义警报。 | {} |
| alerting.discord | 类型为 discord 的警报配置。
详见 配置 Discord 警报。 | {} |
| alerting.email | 类型为 email 的警报配置。
详见 配置电子邮件警报。 | {} |
| alerting.gitea | 类型为 gitea 的警报配置。
详见 配置 Gitea 警报。 | {} |
| alerting.github | 类型为 github 的警报配置。
详见 配置 GitHub 警报。 | {} |
| alerting.gitlab | 类型为 gitlab 的警报配置。
详见 配置 GitLab 警报。 | {} |
| alerting.googlechat | 类型为 googlechat 的警报配置。
详见 配置 Google Chat 警报。 | {} |
| alerting.gotify | 类型为 gotify 的警报配置。
详见 配置 Gotify 警报。 | {} |
| alerting.ilert | 类型为 ilert 的警报配置。
详见 配置 ilert 警报。 | {} |
| alerting.incident-io | 类型为 incident-io 的警报配置。
详见 配置 Incident.io 警报。 | {} |
| alerting.jetbrainsspace | 类型为 jetbrainsspace 的警报配置。
详见 配置 JetBrains Space 警报。 | {} |
| alerting.matrix | 类型为 matrix 的警报配置。
详见 配置 Matrix 警报。 | {} |
| alerting.mattermost | 类型为 mattermost 的警报配置。
详见 配置 Mattermost 警报。 | {} |
| alerting.messagebird | 类型为 messagebird 的警报配置。
详见 配置 Messagebird 警报。 | {} |
| alerting.ntfy | 类型为 ntfy 的警报配置。
详见 配置 Ntfy 警报。 | {} |
| alerting.opsgenie | 类型为 opsgenie 的警报配置。
详见 配置 Opsgenie 警报。 | {} |
| alerting.pagerduty | 类型为 pagerduty 的警报配置。
详见 配置 PagerDuty 警报。 | {} |
| alerting.pushover | 类型为 pushover 的警报配置。
详见 配置 Pushover 警报。 | {} |
| alerting.slack | 类型为 slack 的警报配置。
详见 配置 Slack 警报。 | {} |
| alerting.teams | 类型为 teams 的警报配置。(已弃用)
详见 配置 Teams 警报。 | {} |
| alerting.teams-workflows | 类型为 teams-workflows 的警报配置。
详见 配置 Teams 工作流警报。 | {} |
| alerting.telegram | 类型为 telegram 的警报配置。
详见 配置 Telegram 警报。 | {} |
| alerting.twilio | 类型为 twilio 的警报设置。
详见 配置 Twilio 警报。 | {} |
| alerting.zulip | 类型为 zulip 的警报配置。
详见 配置 Zulip 警报。 | {} |
| alerting.homeassistant | 类型为 homeassistant 的警报配置。
详见 配置 HomeAssistant 警报。 | {} |
#### 配置 AWS SES 警报
| 参数 | 描述 | 默认值 |
|:-----------------------------------|:-----------------------------------------------------------------------------------------|:--------------|
|
alerting.aws-ses | 类型为 aws-ses 的警报设置 | {} |
| alerting.aws-ses.access-key-id | AWS 访问密钥 ID | 可选 "" |
| alerting.aws-ses.secret-access-key| AWS 密钥 | 可选 "" |
| alerting.aws-ses.region | AWS 区域 | 必填 "" |
| alerting.aws-ses.from | 发送邮件的电子邮箱地址(应在 SES 中注册) | 必填 "" |
| alerting.aws-ses.to | 用逗号分隔的通知电子邮箱地址列表 | 必填 "" |
| alerting.aws-ses.default-alert | 默认警报配置。
详见 设置默认警报 | 不适用 |alerting:
aws-ses:
access-key-id: "..."
secret-access-key: "..."
region: "us-east-1"
from: "status@example.com"
to: "user@example.com"endpoints:
- name: website
interval: 30s
url: "https://twin.sh/health"
conditions:
- "[STATUS] == 200"
- "[BODY].status == UP"
- "[RESPONSE_TIME] < 300"
alerts:
- type: aws-ses
failure-threshold: 5
send-on-resolved: true
description: "healthcheck failed"
如果未定义 access-key-id 和 secret-access-key,Gatus 将回退到 IAM 认证。确保您有使用
ses:SendEmail 的权限。
#### 配置 Discord 警报
| 参数 | 说明 | 默认值 |
|:-------------------------------------|:-------------------------------------------------------------------------------------------|:------------------------------------|
|
alerting.discord | 类型为 discord 的警报配置 | {} |
| alerting.discord.webhook-url | Discord Webhook URL | 必填 "" |
| alerting.discord.title | 通知标题 | ":helmet_with_white_cross: Gatus" |
| alerting.discord.default-alert | 默认警报配置。
参见 设置默认警报 | 无 |
| alerting.discord.overrides | 可能优先于默认配置的覆盖列表 | [] |
| alerting.discord.overrides[].group | 该配置将覆盖的端点组 | "" |
| alerting.discord.overrides[]. | 参见 alerting.discord. 参数 | {} |alerting:
discord:
webhook-url: "https://discord.com/api/webhooks//"endpoints:
- name: website
url: "https://twin.sh/health"
interval: 5m
conditions:
- "[STATUS] == 200"
- "[BODY].status == UP"
- "[RESPONSE_TIME] < 300"
alerts:
- type: discord
description: "healthcheck failed"
send-on-resolved: true
#### 配置电子邮件警报
| 参数 | 描述 | 默认值 |
|:---------------------------------|:-----------------------------------------------------------------------------------------|:-------------|
| alerting.email | 类型为 email 的警报配置 | {} |
| alerting.email.from | 用于发送警报的电子邮件 | 必填 "" |
| alerting.email.username | 用于发送警报的 SMTP 服务器用户名。如果为空,使用 alerting.email.from。 | "" |
| alerting.email.password | 用于发送警报的 SMTP 服务器密码。如果为空,则不进行身份验证。 | "" |
| alerting.email.host | 邮件服务器主机(例如 smtp.gmail.com) | 必填 "" |
| alerting.email.port | 邮件服务器监听的端口(例如 587) | 必填 0 |
| alerting.email.to | 发送警报的电子邮件地址 | 必填 "" |
| alerting.email.default-alert | 默认警报配置。
参见 设置默认警报 | 不适用 |
| alerting.email.client.insecure | 是否跳过 TLS 验证 | false |
| alerting.email.overrides | 可能优先于默认配置的覆盖列表 | [] |
| alerting.email.overrides[].group | 该配置将覆盖的端点组 | "" |
| alerting.email.overrides[]. | 参见 alerting.email. 参数 | {} |alerting:
email:
from: "from@example.com"
username: "from@example.com"
password: "hunter2"
host: "mail.example.com"
port: 587
to: "recipient1@example.com,recipient2@example.com"
client:
insecure: false
# You can also add group-specific to keys, which will
# override the to key above for the specified groups
overrides:
- group: "core"
to: "recipient3@example.com,recipient4@example.com"endpoints:
- name: website
url: "https://twin.sh/health"
interval: 5m
conditions:
- "[STATUS] == 200"
- "[BODY].status == UP"
- "[RESPONSE_TIME] < 300"
alerts:
- type: email
description: "healthcheck failed"
send-on-resolved: true- name: back-end
group: core
url: "https://example.org/"
interval: 5m
conditions:
- "[STATUS] == 200"
- "[CERTIFICATE_EXPIRATION] > 48h"
alerts:
- type: email
description: "healthcheck failed"
send-on-resolved: true
⚠ 一些邮件服务器响应非常缓慢。
#### 配置 Gitea 警报
| 参数 | 说明 | 默认值 |
|:------------------------------|:-------------------------------------------------------------------------------------------------------|:-------------|
|
alerting.gitea | 类型为 gitea 的警报配置 | {} |
| alerting.gitea.repository-url| Gitea 仓库 URL(例如 https://gitea.com/TwiN/example) | 必填 "" |
| alerting.gitea.token | 用于身份验证的个人访问令牌。
至少需对 issue 拥有读写权限,对元数据拥有只读权限。 | 必填 "" |
| alerting.github.default-alert| 默认警报配置。
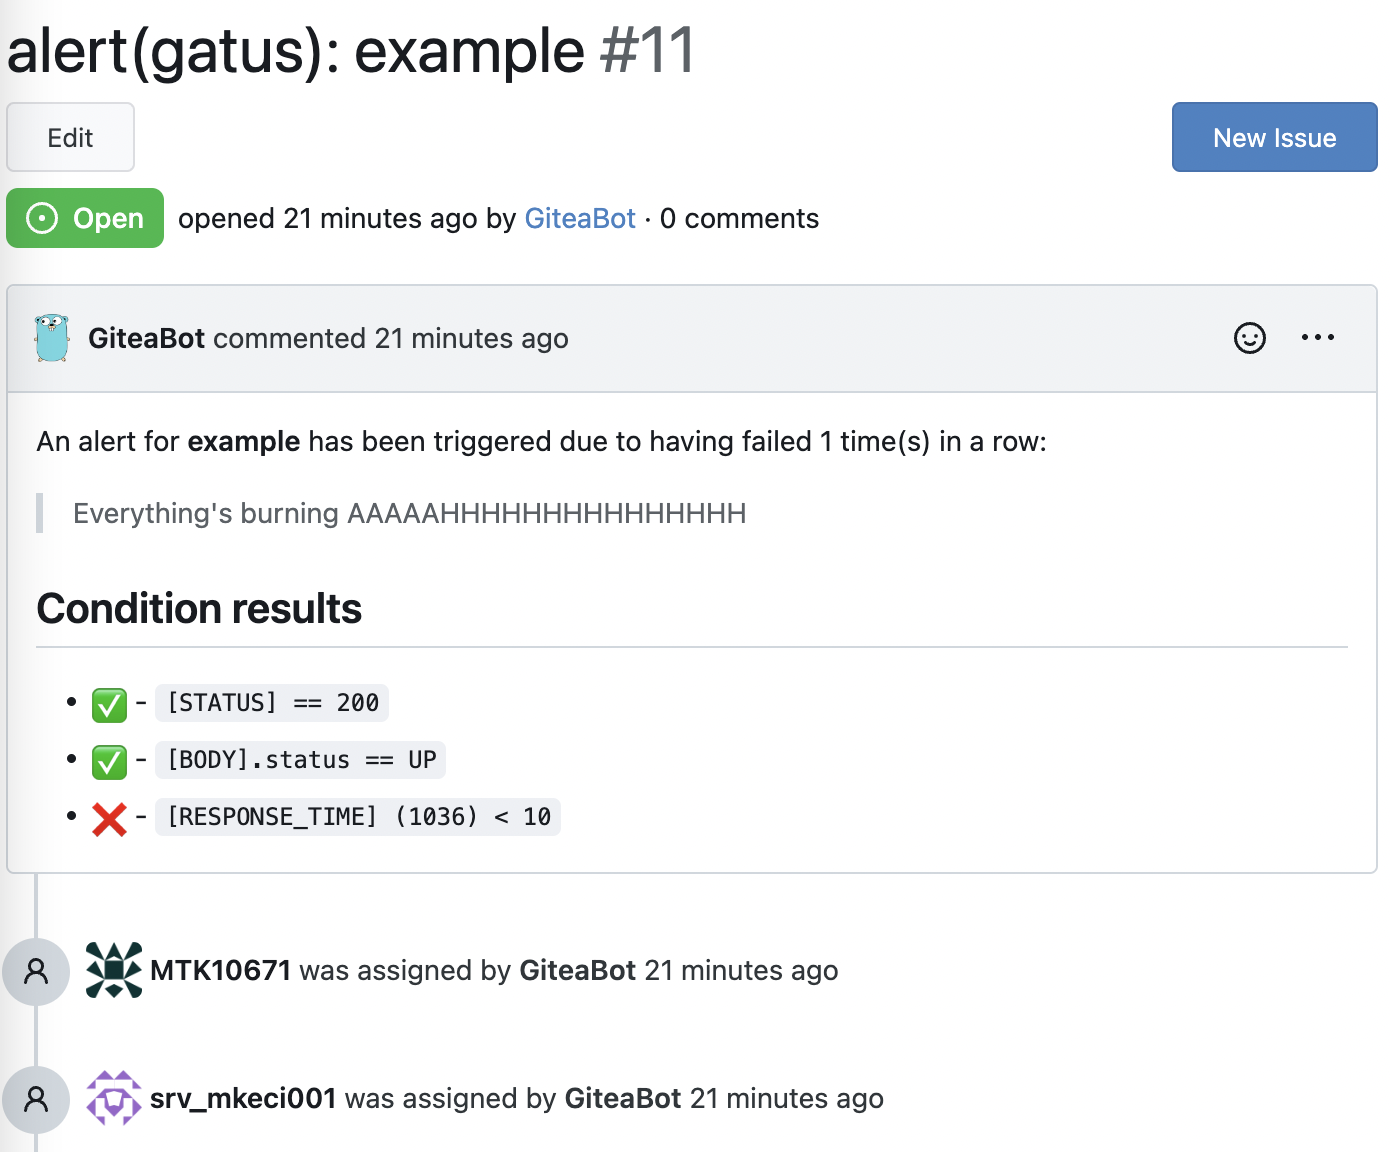
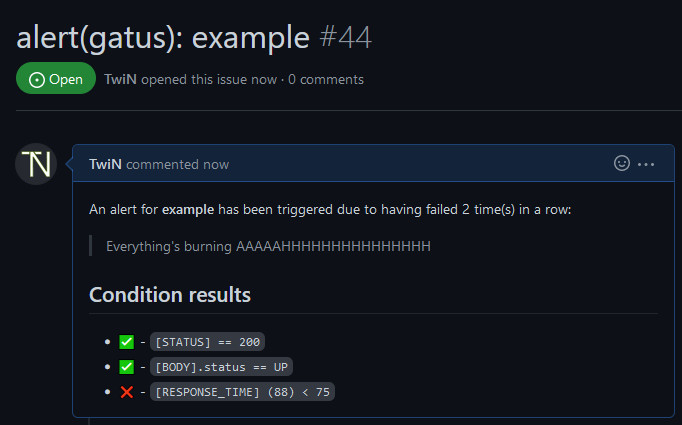
详见 设置默认警报。 | 不适用 |Gitea 警报提供者会为每个警报创建一个 issue,标题前缀为
alert(gatus):,后缀为端点显示名称。
如果端点警报中 send-on-resolved 设置为 true,当警报解决时,该 issue 会被自动关闭。alerting:
gitea:
repository-url: "https://gitea.com/TwiN/test"
token: "349d63f16......"endpoints:
- name: example
url: "https://twin.sh/health"
interval: 5m
conditions:
- "[STATUS] == 200"
- "[BODY].status == UP"
- "[RESPONSE_TIME] < 75"
alerts:
- type: gitea
failure-threshold: 2
success-threshold: 3
send-on-resolved: true
description: "Everything's burning AAAAAHHHHHHHHHHHHHHH"
#### 配置 GitHub 警报
| 参数 | 描述 | 默认值 |
|:---------------------------------|:-----------------------------------------------------------------------------------------------------------|:--------------|
|
alerting.github | 类型为 github 的警报配置 | {} |
| alerting.github.repository-url | GitHub 仓库 URL(例如 https://github.com/TwiN/example) | 必填 "" |
| alerting.github.token | 用于认证的个人访问令牌。
必须至少对问题有读写权限,对元数据有只读权限。 | 必填 "" |
| alerting.github.default-alert | 默认警报配置。
详见设置默认警报。 | 不适用 |GitHub 警报提供者会为每个警报创建一个以
alert(gatus): 为前缀、以端点显示名称为后缀的问题。
如果端点警报中的 send-on-resolved 设置为 true,警报解决时该问题将自动关闭。alerting:
github:
repository-url: "https://github.com/TwiN/test"
token: "github_pat_12345..."endpoints:
- name: example
url: "https://twin.sh/health"
interval: 5m
conditions:
- "[STATUS] == 200"
- "[BODY].status == UP"
- "[RESPONSE_TIME] < 75"
alerts:
- type: github
failure-threshold: 2
success-threshold: 3
send-on-resolved: true
description: "Everything's burning AAAAAHHHHHHHHHHHHHHH"
#### 配置 GitLab 警报
| 参数 | 描述 | 默认值 |
|:----------------------------------|:-----------------------------------------------------------------------------------------------------------------|:-------------|
|
alerting.gitlab | 类型为 gitlab 的警报配置 | {} |
| alerting.gitlab.webhook-url | GitLab 警报 webhook URL(例如 https://gitlab.com/yourusername/example/alerts/notify/gatus/xxxxxxxxxxxxxxxx.json) | 必填 "" |
| alerting.gitlab.authorization-key | GitLab 警报授权密钥。 | 必填 "" |
| alerting.gitlab.severity | 覆盖默认严重性(critical),可选值为 critical, high, medium, low, info, unknown | "" |
| alerting.gitlab.monitoring-tool | 覆盖监控工具名称(gatus) | "gatus" |
| alerting.gitlab.environment-name| 设置 GitLab 环境名称。显示仪表盘上的警报时必填。 | "" |
| alerting.gitlab.service | 覆盖端点显示名称 | "" |
| alerting.gitlab.default-alert | 默认警报配置。
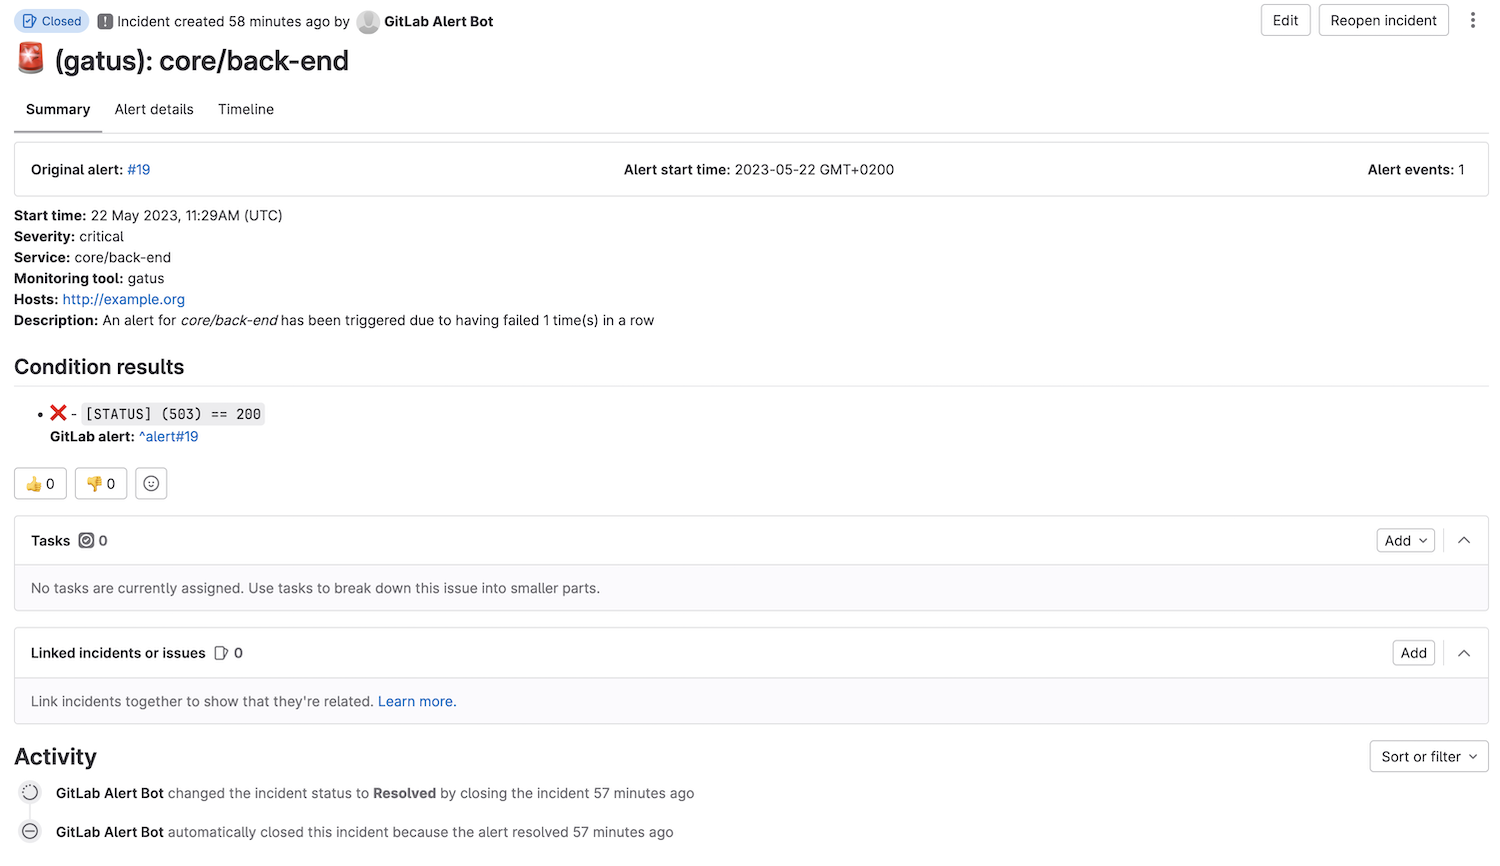
参见 设置默认警报。 | 不适用 |GitLab 警报提供者为每个警报创建一个以
alert(gatus): 为前缀、以端点显示名称为后缀的警报。
如果端点警报中 send-on-resolved 设置为 true,警报在解决后将自动关闭。
请参见 https://docs.gitlab.com/ee/operations/incident_management/integrations.html#configuration 配置端点。alerting:
gitlab:
webhook-url: "https://gitlab.com/hlidotbe/example/alerts/notify/gatus/xxxxxxxxxxxxxxxx.json"
authorization-key: "12345"endpoints:
- name: example
url: "https://twin.sh/health"
interval: 5m
conditions:
- "[STATUS] == 200"
- "[BODY].status == UP"
- "[RESPONSE_TIME] < 75"
alerts:
- type: gitlab
failure-threshold: 2
success-threshold: 3
send-on-resolved: true
description: "Everything's burning AAAAAHHHHHHHHHHHHHHH"
#### 配置 Google Chat 警报
| 参数 | 说明 | 默认值 |
|:----------------------------------------|:------------------------------------------------------------------------------------------|:--------------|
|
alerting.googlechat | googlechat 类型警报的配置 | {} |
| alerting.googlechat.webhook-url | Google Chat Webhook URL | 必填 "" |
| alerting.googlechat.client | 客户端配置。
参见客户端配置。 | {} |
| alerting.googlechat.default-alert | 默认警报配置。
参见设置默认警报。 | 不适用 |
| alerting.googlechat.overrides | 可能优先于默认配置的覆盖列表 | [] |
| alerting.googlechat.overrides[].group | 该配置将覆盖的端点组 | "" |
| alerting.googlechat.overrides[]. | 参见 alerting.googlechat. 参数 | {} |alerting:
googlechat:
webhook-url: "https://chat.googleapis.com/v1/spaces/*/messages?key=&token="endpoints:
- name: website
url: "https://twin.sh/health"
interval: 5m
conditions:
- "[STATUS] == 200"
- "[BODY].status == UP"
- "[RESPONSE_TIME] < 300"
alerts:
- type: googlechat
description: "healthcheck failed"
send-on-resolved: true
#### 配置 Gotify 警报
| 参数 | 说明 | 默认值 |
|:--------------------------------------------|:------------------------------------------------------------------------------------------|:----------------------|
| alerting.gotify | 类型为 gotify 的警报配置 | {} |
| alerting.gotify.server-url | Gotify 服务器 URL | 必填 "" |
| alerting.gotify.token | 用于认证的令牌 | 必填 "" |
| alerting.gotify.priority | 根据 Gotify 标准的警报优先级 | 5 |
| alerting.gotify.title | 通知标题 | "Gatus: |
| alerting.gotify.default-alert | 默认警报配置。
参见 设置默认警报。 | 无 |#### 配置 ilert 警报
| 参数 | 说明 | 默认值 |
|:------------------------------------------|:-----------------------------------------------------------------------------------------|:--------|
|
alerting.ilert | 类型为 ilert 的警报配置 | {} |
| alerting.ilert.integration-key | ilert 警报源集成密钥 | "" |
| alerting.ilert.default-alert | 默认警报配置。
参见 设置默认警报 | 无 |
| alerting.ilert.overrides | 可覆盖默认配置的优先列表 | [] |
| alerting.ilert.overrides[].group | 该配置将覆盖的端点组 | "" |
| alerting.ilert.overrides[]. | 参见 alerting.ilert. 参数 | {} |强烈建议为类型为
ilert 的警报将 endpoints[].alerts[].send-on-resolved 设置为 true,
因为与其他警报不同,设置该参数为 true 的操作不会创建另一个警报,
而是将警报在 ilert 中标记为已解决。行为:
- 默认情况下,使用
alerting.ilert.integration-key 作为集成密钥
如果被评估的端点属于与 alerting.ilert.overrides[].group 值匹配的组(endpoints[].group),
则提供程序将使用该覆盖的集成密钥,而非 alerting.ilert.integration-keyalerting:
ilert:
integration-key: ""
# You can also add group-specific integration keys, which will
# override the integration key above for the specified groups
overrides:
- group: "core"
integration-key: ""endpoints:
- name: website
url: "https://twin.sh/health"
interval: 30s
conditions:
- "[STATUS] == 200"
- "[BODY].status == UP"
- "[RESPONSE_TIME] < 300"
alerts:
- type: ilert
failure-threshold: 3
success-threshold: 5
send-on-resolved: true
description: "healthcheck failed"
alerting:
gotify:
server-url: "https://gotify.example"
token: ""endpoints:
- name: website
url: "https://twin.sh/health"
interval: 5m
conditions:
- "[STATUS] == 200"
- "[BODY].status == UP"
- "[RESPONSE_TIME] < 300"
alerts:
- type: gotify
description: "healthcheck failed"
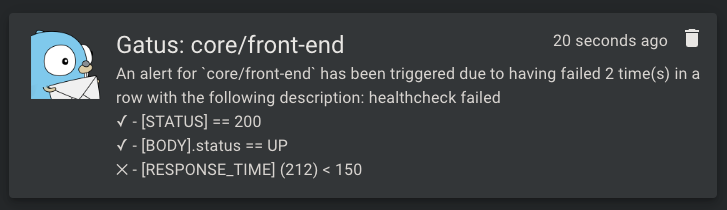
send-on-resolved: true
下面是通知的示例:
#### 配置 HomeAssistant 警报
要配置 HomeAssistant 警报,您需要将以下内容添加到您的配置文件中:
alerting:
homeassistant:
url: "http://homeassistant:8123" # URL of your HomeAssistant instance
token: "YOUR_LONG_LIVED_ACCESS_TOKEN" # Long-lived access token from HomeAssistantendpoints:
- name: my-service
url: "https://my-service.com"
interval: 5m
conditions:
- "[STATUS] == 200"
alerts:
- type: homeassistant
enabled: true
send-on-resolved: true
description: "My service health check"
failure-threshold: 3
success-threshold: 2
警报将作为事件发送到 HomeAssistant,事件类型为 。事件数据包括:
status:“triggered”或“resolved”
endpoint:被监控端点的名称
description:如果提供,则为警报描述
conditions:条件及其结果的列表
failure_count:连续失败次数(触发时)
success_count:连续成功次数(解决时)您可以在 HomeAssistant 自动化中使用这些事件来:
- 发送通知
- 控制设备
- 触发场景
- 记录历史
- 以及更多
HomeAssistant 自动化示例:automation:
- alias: "Gatus Alert Handler"
trigger:
platform: event
event_type: gatus_alert
action:
- service: notify.notify
data_template:
title: "Gatus Alert: {{ trigger.event.data.endpoint }}"
message: >
Status: {{ trigger.event.data.status }}
{% if trigger.event.data.description %}
Description: {{ trigger.event.data.description }}
{% endif %}
{% for condition in trigger.event.data.conditions %}
{{ '✅' if condition.success else '❌' }} {{ condition.condition }}
{% endfor %}
要获取您的 HomeAssistant 长期访问令牌:
- 打开 HomeAssistant
- 点击您的用户名(左下角)
- 向下滚动到“长期访问令牌”
- 点击“创建令牌”
- 给它命名(例如,“Gatus”)
- 复制令牌 - 您只会看到它一次!
#### 配置 Incident.io 警报
| 参数 | 描述 | 默认值 |
|:-----------------------------------------|:-------------------------------------------------------------------------------------------|:--------------|
| alerting.incident-io | 类型为 incident-io 的警报配置 | {} |
| alerting.incident-io.url | 触发警报事件的 URL | 必填 "" |
| alerting.incident-io.auth-token | 用于身份验证的令牌 | 必填 "" |
| alerting.incident-io.source-url | 来源 URL | "" |
| alerting.incident-io.default-alert | 默认警报配置。
参见 设置默认警报 | 不适用 |
| alerting.incident-io.overrides | 可能优先于默认配置的覆盖列表 | [] |
| alerting.incident-io.overrides[].group | 该配置将被此配置覆盖的端点组 | "" |
| alerting.incident-io.overrides[]. | 参见 alerting.incident-io. 参数 | {} |alerting:
incident-io:
url: "*"
auth-token: ""endpoints:
- name: website
url: "https://twin.sh/health"
interval: 30s
conditions:
- "[STATUS] == 200"
- "[BODY].status == UP"
- "[RESPONSE_TIME] < 300"
alerts:
- type: incident-io
description: "healthcheck failed"
send-on-resolved: true
为了获取所需的警报源配置ID和认证令牌,您必须配置一个HTTP警报源。_注意:_ 源配置ID的格式为
https://api.incident.io/v2/alert_events/http/$ID,令牌应作为Bearer令牌传递,如:Authorization: Bearer $TOKEN
#### 配置 JetBrains Space 警报
| 参数 | 描述 | 默认值 |
|:--------------------------------------------|:-------------------------------------------------------------------------------------------|:--------------|
|
| 类型为 jetbrainsspace 的警报配置 | {} |
| alerting.jetbrainsspace.project | JetBrains Space 项目名称 | 必填 "" |
| alerting.jetbrainsspace.channel-id | JetBrains Space 聊天频道ID | 必填 "" |
| alerting.jetbrainsspace.token | 用于认证的令牌 | 必填 "" |
| alerting.jetbrainsspace.default-alert | 默认警报配置。
参见 设置默认警报 | 不适用 |
| alerting.jetbrainsspace.overrides | 可能优先于默认配置的覆盖列表 | [] |
| alerting.jetbrainsspace.overrides[].group | 该配置将被此配置覆盖的端点组 | "" |
| alerting.jetbrainsspace.overrides[]. | 参见 alerting.jetbrainsspace. 参数 | {} |alerting:
jetbrainsspace:
project: myproject
channel-id: ABCDE12345
token: ""endpoints:
- name: website
url: "https://twin.sh/health"
interval: 5m
conditions:
- "[STATUS] == 200"
alerts:
- type: jetbrainsspace
description: "healthcheck failed"
send-on-resolved: true
下面是通知的示例:
#### 配置 Matrix 警报
| 参数 | 描述 | 默认值 |
|:-----------------------------------------|:-------------------------------------------------------------------------------------------|:-----------------------------------|
|
alerting.matrix | 类型为 matrix 的警报配置 | {} |
| alerting.matrix.server-url | Homeserver URL | https://matrix-client.matrix.org |
| alerting.matrix.access-token | 机器人用户访问令牌(参见 https://webapps.stackexchange.com/q/131056) | 必填 "" |
| alerting.matrix.internal-room-id | 发送警报的房间内部 ID(可在房间设置 > 高级中找到) | 必填 "" |
| alerting.matrix.default-alert | 默认警报配置。
参见设置默认警报 | 不适用 |alerting:
matrix:
server-url: "https://matrix-client.matrix.org"
access-token: "123456"
internal-room-id: "!example:matrix.org"endpoints:
- name: website
interval: 5m
url: "https://twin.sh/health"
conditions:
- "[STATUS] == 200"
- "[BODY].status == UP"
- "[RESPONSE_TIME] < 300"
alerts:
- type: matrix
send-on-resolved: true
description: "healthcheck failed"
#### 配置 Mattermost 警报
| 参数 | 描述 | 默认值 |
|:---------------------------------------------|:--------------------------------------------------------------------------------------------|:--------------|
| alerting.mattermost | 类型为 mattermost 的警报配置 | {} |
| alerting.mattermost.webhook-url | Mattermost Webhook URL | 必填 "" |
| alerting.mattermost.channel | Mattermost 频道名称覆盖(可选) | "" |
| alerting.mattermost.client | 客户端配置。
请参阅客户端配置。 | {} |
| alerting.mattermost.default-alert | 默认警报配置。
请参阅设置默认警报。 | 不适用 |
| alerting.mattermost.overrides | 可以优先于默认配置的覆盖列表 | [] |
| alerting.mattermost.overrides[].group | 将被此配置覆盖的端点组 | "" |
| alerting.mattermost.overrides[]. | 参见 alerting.mattermost. 参数 | {} |alerting:
mattermost:
webhook-url: "http:///hooks/"
client:
insecure: trueendpoints:
- name: website
url: "https://twin.sh/health"
interval: 5m
conditions:
- "[STATUS] == 200"
- "[BODY].status == UP"
- "[RESPONSE_TIME] < 300"
alerts:
- type: mattermost
description: "healthcheck failed"
send-on-resolved: true
Here's an example of what the notifications look like: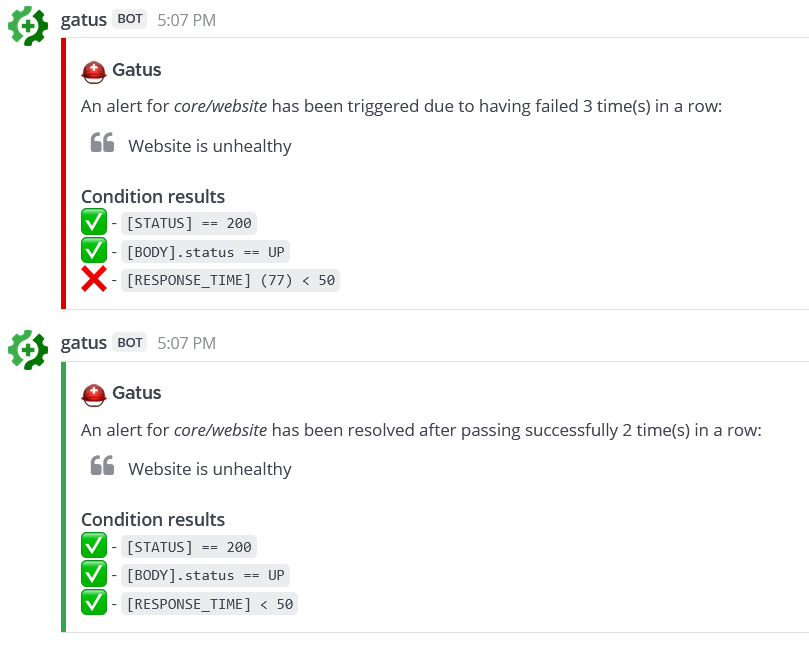
#### 配置 Messagebird 警报
| 参数 | 描述 | 默认值 |
|:-------------------------------------|:-------------------------------------------------------------------------------------------|:--------------|
|
alerting.messagebird | 类型为 messagebird 的警报配置 | {} |
| alerting.messagebird.access-key | Messagebird 访问密钥 | 必填 "" |
| alerting.messagebird.originator | 消息的发送者 | 必填 "" |
| alerting.messagebird.recipients | 消息的接收者 | 必填 "" |
| alerting.messagebird.default-alert | 默认警报配置。
详情见 设置默认警报 | 不适用 |使用 Messagebird 发送 短信 警报的示例:
alerting:
messagebird:
access-key: "..."
originator: "31619191918"
recipients: "31619191919,31619191920"endpoints:
- name: website
interval: 5m
url: "https://twin.sh/health"
conditions:
- "[STATUS] == 200"
- "[BODY].status == UP"
- "[RESPONSE_TIME] < 300"
alerts:
- type: messagebird
failure-threshold: 3
send-on-resolved: true
description: "healthcheck failed"
#### 配置 Ntfy 警报
| 参数 | 描述 | 默认值 |
|:-------------------------------------|:---------------------------------------------------------------------------------------------------------------------------------------------|:------------------|
| alerting.ntfy | 类型为 ntfy 的警报配置 | {} |
| alerting.ntfy.topic | 警报发送的主题 | 必填 "" |
| alerting.ntfy.url | 目标服务器的 URL | https://ntfy.sh |
| alerting.ntfy.token | 受限主题的访问令牌 | "" |
| alerting.ntfy.email | 用于附加电子邮件通知的电子邮件地址 | "" |
| alerting.ntfy.click | 点击通知时打开的网站 | "" |
| alerting.ntfy.priority | 警报的优先级 | 3 |
| alerting.ntfy.disable-firebase | 是否禁用通过 firebase 的消息推送传递。ntfy.sh 默认启用 | false |
| alerting.ntfy.disable-cache | 是否禁用服务器端消息缓存。ntfy.sh 默认启用 | false |
| alerting.ntfy.default-alert | 默认警报配置。
参见设置默认警报 | 不适用 |
| alerting.ntfy.overrides | 可以优先于默认配置的覆盖列表 | [] |
| alerting.ntfy.overrides[].group | 将被此配置覆盖的端点组 | "" |
| alerting.ntfy.overrides[]. | 参见 alerting.ntfy. 参数 | {} |ntfy 是一个非常棒的项目,允许您订阅桌面和移动通知,
使其成为 Gatus 的绝佳补充。
示例:
alerting:
ntfy:
topic: "gatus-test-topic"
priority: 2
token: faketoken
default-alert:
failure-threshold: 3
send-on-resolved: true
# You can also add group-specific to keys, which will
# override the to key above for the specified groups
overrides:
- group: "other"
topic: "gatus-other-test-topic"
priority: 4
click: "https://example.com"endpoints:
- name: website
interval: 5m
url: "https://twin.sh/health"
conditions:
- "[STATUS] == 200"
- "[BODY].status == UP"
- "[RESPONSE_TIME] < 300"
alerts:
- type: ntfy
- name: other example
group: other
interval: 30m
url: "https://example.com"
conditions:
- "[STATUS] == 200"
- "[BODY].status == UP"
alerts:
- type: ntfy
description: example
#### 配置 Opsgenie 警报
| 参数 | 描述 | 默认值 |
|:--------------------------------|:------------------------------------------------------------------------------------------|:---------------------|
| alerting.opsgenie | 类型为 opsgenie 的警报配置 | {} |
| alerting.opsgenie.api-key | Opsgenie API 密钥 | 必填 "" |
| alerting.opsgenie.priority | 警报的优先级 | P1 |
| alerting.opsgenie.source | 警报的来源字段 | gatus |
| alerting.opsgenie.entity-prefix | 实体字段前缀 | gatus- |
| alerting.opsgenie.alias-prefix | 别名字段前缀 | gatus-healthcheck- |
| alerting.opsgenie.tags | 警报标签 | [] |
| alerting.opsgenie.default-alert | 默认警报配置。
详见 设置默认警报 | 不适用 |Opsgenie 提供者将自动打开和关闭警报。
alerting:
opsgenie:
api-key: "00000000-0000-0000-0000-000000000000"
#### 配置 PagerDuty 警报
| 参数 | 描述 | 默认值 |
|:---------------------------------------|:------------------------------------------------------------------------------------------|:--------|
| alerting.pagerduty | 类型为 pagerduty 的警报配置 | {} |
| alerting.pagerduty.integration-key | PagerDuty Events API v2 集成密钥 | "" |
| alerting.pagerduty.default-alert | 默认警报配置。
参见设置默认警报 | 不适用 |
| alerting.pagerduty.overrides | 可能优先于默认配置的覆盖列表 | [] |
| alerting.pagerduty.overrides[].group | 该配置将覆盖的端点组 | "" |
| alerting.pagerduty.overrides[]. | 参见 alerting.pagerduty. 参数 | {} |强烈建议将类型为
pagerduty 的警报的 endpoints[].alerts[].send-on-resolved 设置为 true,
因为与其他警报不同,设置该参数为 true 所产生的操作不会创建另一个事件,
而是将 PagerDuty 上的事件标记为已解决。行为:
- 默认情况下,使用
alerting.pagerduty.integration-key 作为集成密钥
如果被评估的端点属于与 alerting.pagerduty.overrides[].group 值匹配的组(endpoints[].group),
该提供程序将使用该覆盖的集成密钥替代 alerting.pagerduty.integration-key 的密钥alerting:
pagerduty:
integration-key: ""
# You can also add group-specific integration keys, which will
# override the integration key above for the specified groups
overrides:
- group: "core"
integration-key: ""endpoints:
- name: website
url: "https://twin.sh/health"
interval: 30s
conditions:
- "[STATUS] == 200"
- "[BODY].status == UP"
- "[RESPONSE_TIME] < 300"
alerts:
- type: pagerduty
failure-threshold: 3
success-threshold: 5
send-on-resolved: true
description: "healthcheck failed"- name: back-end
group: core
url: "https://example.org/"
interval: 5m
conditions:
- "[STATUS] == 200"
- "[CERTIFICATE_EXPIRATION] > 48h"
alerts:
- type: pagerduty
failure-threshold: 3
success-threshold: 5
send-on-resolved: true
description: "healthcheck failed"
#### 配置 Pushover 警报
| 参数 | 说明 | 默认值 |
|:------------------------------------|:-----------------------------------------------------------------------------------------------------|:----------------------------|
| alerting.pushover | 类型为 pushover 的警报配置 | {} |
| alerting.pushover.application-token | Pushover 应用程序令牌 | "" |
| alerting.pushover.user-key | 用户或组密钥 | "" |
| alerting.pushover.title | 通过 Pushover 发送的所有消息的固定标题 | "Gatus: |
| alerting.pushover.priority | 所有消息的优先级,范围从 -2(非常低)到 2(紧急) | 0 |
| alerting.pushover.resolved-priority | 解决时消息的优先级覆盖,范围从 -2(非常低)到 2(紧急) | 0 |
| alerting.pushover.sound | 所有消息的声音
详见 sounds 了解所有有效选项。 | "" |
| alerting.pushover.ttl | 设置消息的存活时间,消息将在此时间后自动从 Pushover 通知中删除 | 0 |
| alerting.pushover.device | 发送消息的设备(可选)
详见 devices 了解详情 | ""(所有设备) |
| alerting.pushover.default-alert | 默认警报配置。
详见 设置默认警报 | 不适用 |alerting:
pushover:
application-token: ""
user-key: ""endpoints:
- name: website
url: "https://twin.sh/health"
interval: 30s
conditions:
- "[STATUS] == 200"
- "[BODY].status == UP"
- "[RESPONSE_TIME] < 300"
alerts:
- type: pushover
failure-threshold: 3
success-threshold: 5
send-on-resolved: true
description: "healthcheck failed"
#### 配置 Slack 警报
| 参数 | 描述 | 默认值 |
|:--------------------------------|:------------------------------------------------------------------------------------------|:-------------|
| alerting.slack | slack 类型警报的配置 | {} |
| alerting.slack.webhook-url | Slack Webhook URL | 必填 "" |
| alerting.slack.default-alert | 默认警报配置。
参见 设置默认警报 | 不适用 |
| alerting.slack.overrides | 可优先于默认配置的覆盖列表 | [] |
| alerting.slack.overrides[].group | 此配置将覆盖的端点组 | "" |
| alerting.slack.overrides[]. | 参见 alerting.slack. 参数 | {} |alerting:
slack:
webhook-url: "https://hooks.slack.com/services///"endpoints:
- name: website
url: "https://twin.sh/health"
interval: 30s
conditions:
- "[STATUS] == 200"
- "[BODY].status == UP"
- "[RESPONSE_TIME] < 300"
alerts:
- type: slack
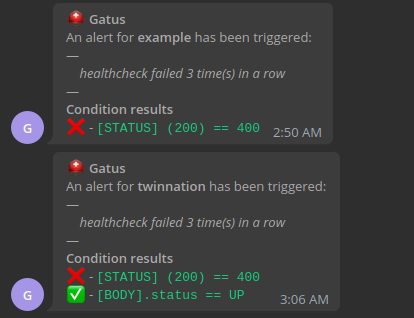
description: "healthcheck failed 3 times in a row"
send-on-resolved: true
- type: slack
failure-threshold: 5
description: "healthcheck failed 5 times in a row"
send-on-resolved: true
Here's an example of what the notifications look like: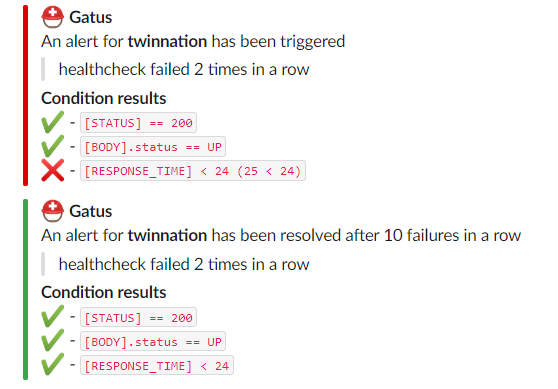
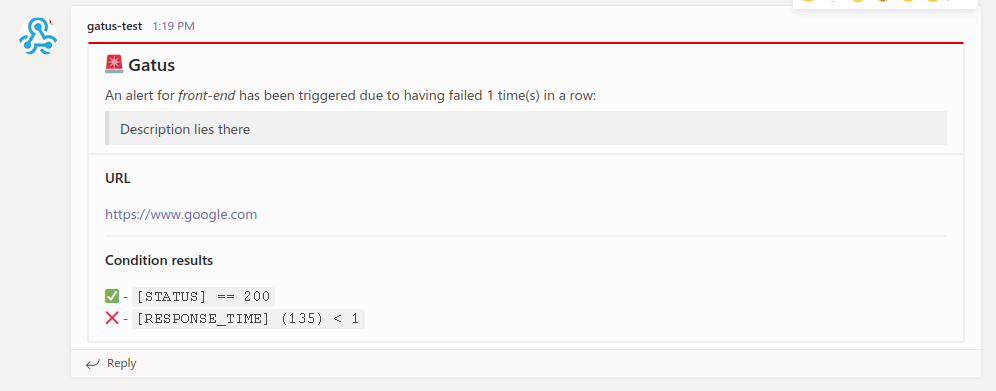
#### 配置 Teams 警报 (已弃用)
[!CAUTION]
已弃用: Microsoft Teams 中的 Office 365 连接器正在被淘汰(来源:Microsoft DevBlog)。
现有连接器将持续工作至 2025 年 12 月。新的 Teams 工作流警报 应与 Microsoft 工作流一起使用,替代此旧配置。
| 参数 | 描述 | 默认值 |
|:-----------------------------------|:-------------------------------------------------------------------------------------------|:--------------------|
|
alerting.teams | teams 类型警报的配置 | {} |
| alerting.teams.webhook-url | Teams Webhook URL | 必填 "" |
| alerting.teams.default-alert | 默认警报配置。
请参阅 设置默认警报 | 不适用 |
| alerting.teams.title | 通知标题 | "🚨 Gatus" |
| alerting.teams.client.insecure | 是否跳过 TLS 验证 | false |
| alerting.teams.overrides | 可优先于默认配置的覆盖列表 | [] |
| alerting.teams.overrides[].group | 此配置将覆盖的端点组 | "" |
| alerting.teams.overrides[]. | 参见 alerting.teams. 参数 | {} |alerting:
teams:
webhook-url: "https://.webhook.office.com/webhookb2/"
client:
insecure: false
# You can also add group-specific to keys, which will
# override the to key above for the specified groups
overrides:
- group: "core"
webhook-url: "https://.webhook.office.com/webhookb3/"endpoints:
- name: website
url: "https://twin.sh/health"
interval: 30s
conditions:
- "[STATUS] == 200"
- "[BODY].status == UP"
- "[RESPONSE_TIME] < 300"
alerts:
- type: teams
description: "healthcheck failed"
send-on-resolved: true- name: back-end
group: core
url: "https://example.org/"
interval: 5m
conditions:
- "[STATUS] == 200"
- "[CERTIFICATE_EXPIRATION] > 48h"
alerts:
- type: teams
description: "healthcheck failed"
send-on-resolved: true
以下是通知的示例:
#### 配置 Teams 工作流警报
[!注意]
此警报兼容 Microsoft Teams 的工作流。要设置工作流并获取 webhook URL,请参阅 Microsoft 文档。
| 参数 | 描述 | 默认值 |
|:------------------------------------------|:-----------------------------------------------------------------------------------------|:-------------------|
|
alerting.teams-workflows | 类型为 teams 的警报配置 | {} |
| alerting.teams-workflows.webhook-url | Teams Webhook URL | 必填 "" |
| alerting.teams-workflows.title | 通知标题 | "⛑ Gatus" |
| alerting.teams-workflows.default-alert | 默认警报配置。
参见 设置默认警报 | 不适用 |
| alerting.teams-workflows.overrides | 可优先于默认配置的覆盖列表 | [] |
| alerting.teams-workflows.overrides[].group | 该配置将覆盖指定的端点组配置 | "" |
| alerting.teams-workflows.overrides[]. | 请参见 alerting.teams-workflows. 参数 | {} |alerting:
teams-workflows:
webhook-url: "https://.webhook.office.com/webhookb2/"
# You can also add group-specific to keys, which will
# override the to key above for the specified groups
overrides:
- group: "core"
webhook-url: "https://.webhook.office.com/webhookb3/"endpoints:
- name: website
url: "https://twin.sh/health"
interval: 30s
conditions:
- "[STATUS] == 200"
- "[BODY].status == UP"
- "[RESPONSE_TIME] < 300"
alerts:
- type: teams-workflows
description: "healthcheck failed"
send-on-resolved: true- name: back-end
group: core
url: "https://example.org/"
interval: 5m
conditions:
- "[STATUS] == 200"
- "[CERTIFICATE_EXPIRATION] > 48h"
alerts:
- type: teams-workflows
description: "healthcheck failed"
send-on-resolved: true
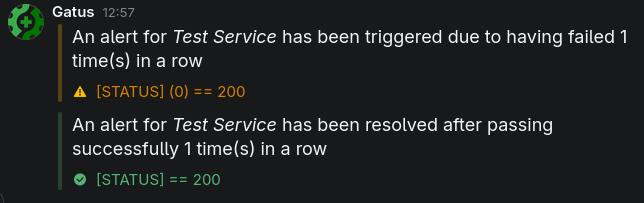
以下是通知的示例: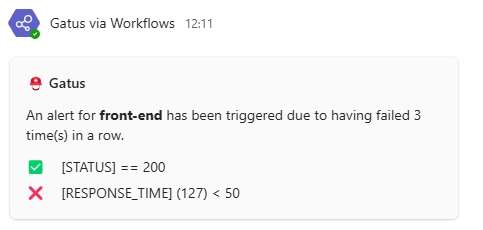
#### 配置 Telegram 警报
| 参数 | 描述 | 默认值 |
|:--------------------------------------|:-------------------------------------------------------------------------------------------|:---------------------------|
|
alerting.telegram | telegram 类型警报的配置 | {} |
| alerting.telegram.token | Telegram 机器人令牌 | 必填 "" |
| alerting.telegram.id | Telegram 用户 ID | 必填 "" |
| alerting.telegram.topic-id | 群组中的 Telegram 主题 ID,对应 Telegram API 中的 message_thread_id | "" |
| alerting.telegram.api-url | Telegram API URL | https://api.telegram.org |
| alerting.telegram.client | 客户端配置。
请参阅客户端配置。 | {} |
| alerting.telegram.default-alert | 默认警报配置。
请参阅设置默认警报 | 无 |
| alerting.telegram.overrides | 可能优先于默认配置的覆盖列表 | [] |
| alerting.telegram.overrides[].group | 此配置将覆盖的端点组 | "" |
| alerting.telegram.overrides[]. | 参见 alerting.telegram. 参数 | {} |alerting:
telegram:
token: "123456:ABC-DEF1234ghIkl-zyx57W2v1u123ew11"
id: "0123456789"
topic-id: "7"endpoints:
- name: website
url: "https://twin.sh/health"
interval: 30s
conditions:
- "[STATUS] == 200"
- "[BODY].status == UP"
alerts:
- type: telegram
send-on-resolved: true
下面是通知的示例:
#### 配置 Twilio 警报
| 参数 | 描述 | 默认值 |
|:------------------------------|:-----------------------------------------------------------------------------------------|:--------------|
|
alerting.twilio | 类型为 twilio 的警报设置 | {} |
| alerting.twilio.sid | Twilio 账户 SID | 必填 "" |
| alerting.twilio.token | Twilio 认证令牌 | 必填 "" |
| alerting.twilio.from | 发送 Twilio 警报的号码 | 必填 "" |
| alerting.twilio.to | 接收 Twilio 警报的号码 | 必填 "" |
| alerting.twilio.default-alert | 默认警报配置。
参见 设置默认警报 | 不适用 |alerting:
twilio:
sid: "..."
token: "..."
from: "+1-234-567-8901"
to: "+1-234-567-8901"endpoints:
- name: website
interval: 30s
url: "https://twin.sh/health"
conditions:
- "[STATUS] == 200"
- "[BODY].status == UP"
- "[RESPONSE_TIME] < 300"
alerts:
- type: twilio
failure-threshold: 5
send-on-resolved: true
description: "healthcheck failed"
#### 配置 Zulip 警报
| 参数 | 说明 | 默认值 |
|:--------------------------------|:------------------------------------------------------------------------------------|:--------------|
| alerting.zulip | 类型为 discord 的警报配置 | {} |
| alerting.zulip.bot-email | 机器人邮箱 | 必填 "" |
| alerting.zulip.bot-api-key | 机器人 API 密钥 | 必填 "" |
| alerting.zulip.domain | 完整的组织域名(例如:yourZulipDomain.zulipchat.com) | 必填 "" |
| alerting.zulip.channel-id | Gatus 发送警报的频道 ID | 必填 "" |
| alerting.zulip.overrides | 可能优先于默认配置的覆盖列表 | [] |
| alerting.zulip.overrides[].group | 将被此配置覆盖的端点组 | "" |
| alerting.zulip.overrides[]. | 参见 alerting.zulip. 参数 | {} |alerting:
zulip:
bot-email: gatus-bot@some.zulip.org
bot-api-key: ""
domain: some.zulip.org
channel-id: 123456endpoints:
- name: website
url: "https://twin.sh/health"
interval: 5m
conditions:
- "[STATUS] == 200"
- "[BODY].status == UP"
- "[RESPONSE_TIME] < 300"
alerts:
- type: zulip
description: "healthcheck failed"
send-on-resolved: true
#### 配置自定义警报
| 参数 | 描述 | 默认值 |
|:--------------------------------|:-------------------------------------------------------------------------------------------|:--------------|
| alerting.custom | 失败或警报时自定义操作的配置 | {} |
| alerting.custom.url | 自定义警报请求的 URL | 必填 "" |
| alerting.custom.method | 请求方法 | GET |
| alerting.custom.body | 自定义警报请求体 | "" |
| alerting.custom.headers | 自定义警报请求头 | {} |
| alerting.custom.client | 客户端配置。
详见 客户端配置。 | {} |
| alerting.custom.default-alert | 默认警报配置。
详见 设置默认警报 | 不适用 |尽管称为警报,您可以使用此功能调用任何内容。
例如,您可以通过一个跟踪新部署的应用程序实现自动回滚,并利用 Gatus,在某个端点开始失败时让 Gatus 调用该应用程序端点。
您的应用程序随后会检查开始失败的端点是否属于最近部署的应用程序,如果是,则自动回滚。
此外,您可以在请求体(
alerting.custom.body)和 URL(alerting.custom.url)中使用以下占位符:
[ALERT_DESCRIPTION](从 endpoints[].alerts[].description 解析)
[ENDPOINT_NAME](从 endpoints[].name 解析)
[ENDPOINT_GROUP](从 endpoints[].group 解析)
[ENDPOINT_URL](从 endpoints[].url 解析)
[RESULT_ERRORS](从给定健康检查的健康评估解析)如果您使用
custom 提供者的警报并将 send-on-resolved 设置为 true,可以使用
[ALERT_TRIGGERED_OR_RESOLVED] 占位符区分通知。
上述占位符将被替换为 TRIGGERED 或 RESOLVED,但可进行修改
(详见本节末尾)。出于所有目的,我们将使用 Slack webhook 配置自定义警报,但您可以调用任何您想要的内容。
alerting:
custom:
url: "https://hooks.slack.com/services///"
method: "POST"
body: |
{
"text": "[ALERT_TRIGGERED_OR_RESOLVED]: [ENDPOINT_GROUP] - [ENDPOINT_NAME] - [ALERT_DESCRIPTION] - [RESULT_ERRORS]"
}
endpoints:
- name: website
url: "https://twin.sh/health"
interval: 30s
conditions:
- "[STATUS] == 200"
- "[BODY].status == UP"
- "[RESPONSE_TIME] < 300"
alerts:
- type: custom
failure-threshold: 10
success-threshold: 3
send-on-resolved: true
description: "health check failed"
请注意,您可以像下面这样自定义
[ALERT_TRIGGERED_OR_RESOLVED] 占位符的解析值:alerting:
custom:
placeholders:
ALERT_TRIGGERED_OR_RESOLVED:
TRIGGERED: "partial_outage"
RESOLVED: "operational"
As a result, the [ALERT_TRIGGERED_OR_RESOLVED] in the body of first example of this section would be replaced by
partial_outage when an alert is triggered and operational when an alert is resolved.
#### 设置默认警报
| 参数 | 描述 | 默认值 |
|:---------------------------------------------|:------------------------------------------------------------------------------|:--------|
|
alerting.*.default-alert.enabled | 是否启用警报 | 不适用 |
| alerting.*.default-alert.failure-threshold | 触发警报前需要连续失败的次数 | 不适用 |
| alerting.*.default-alert.success-threshold | 标记正在进行的事件为已解决前需要连续成功的次数 | 不适用 |
| alerting.*.default-alert.send-on-resolved | 一旦触发的警报被标记为已解决,是否发送通知 | 不适用 |
| alerting.*.default-alert.description | 警报描述。将包含在发送的警报中 | 不适用 |⚠ 即使设置了提供商的默认警报,您仍必须在端点配置中指定警报的
type。虽然您可以直接在端点定义中指定警报配置,但这很繁琐,且可能导致配置文件非常长。
为避免此类问题,您可以使用每个提供商配置中存在的
default-alert 参数:alerting:
slack:
webhook-url: "https://hooks.slack.com/services///"
default-alert:
description: "health check failed"
send-on-resolved: true
failure-threshold: 5
success-threshold: 5
因此,您的 Gatus 配置看起来更加整洁:
endpoints:
- name: example
url: "https://example.org"
conditions:
- "[STATUS] == 200"
alerts:
- type: slack
- name: other-example
url: "https://example.com"
conditions:
- "[STATUS] == 200"
alerts:
- type: slack
它还允许你执行类似这样的操作:endpoints:
- name: example
url: "https://example.org"
conditions:
- "[STATUS] == 200"
alerts:
- type: slack
failure-threshold: 5
- type: slack
failure-threshold: 10
- type: slack
failure-threshold: 15
当然,你也可以混合使用警报类型:
alerting:
slack:
webhook-url: "https://hooks.slack.com/services///"
default-alert:
failure-threshold: 3
pagerduty:
integration-key: ""
default-alert:
failure-threshold: 5endpoints:
- name: endpoint-1
url: "https://example.org"
conditions:
- "[STATUS] == 200"
alerts:
- type: slack
- type: pagerduty
- name: endpoint-2
url: "https://example.org"
conditions:
- "[STATUS] == 200"
alerts:
- type: slack
- type: pagerduty
维护
如果您有维护时间窗口,您可能不希望被警报打扰。
为此,您需要使用维护配置:| 参数 | 说明 | 默认值 |
|:-------------------------|:------------------------------------------------------------------------------------------------------------------------------------------------------------------------------------------|:-------------|
|
maintenance.enabled | 是否启用维护期间 | true |
| maintenance.start | 维护窗口开始时间,格式为 hh:mm(例如 23:00) | 必填 "" |
| maintenance.duration | 维护窗口持续时间(例如 1h,30m) | 必填 "" |
| maintenance.timezone | 维护窗口时区格式(例如 Europe/Amsterdam)。
更多信息见时区数据库时区列表 | UTC |
| maintenance.every | 维护期间适用的星期几(例如 [Monday, Thursday])。
如果为空,维护窗口适用于每天 | [] |示例如下:
maintenance:
start: 23:00
duration: 1h
timezone: "Europe/Amsterdam"
every: [Monday, Thursday]
请注意,您也可以将每一天分别写在不同的行上:
maintenance:
start: 23:00
duration: 1h
timezone: "Europe/Amsterdam"
every:
- Monday
- Thursday
您还可以针对每个端点指定维护时间窗口:
endpoints:
- name: endpoint-1
url: "https://example.org"
maintenance-windows:
- start: "07:30"
duration: 40m
timezone: "Europe/Berlin"
- start: "14:30"
duration: 1h
timezone: "Europe/Berlin"
安全
| 参数 | 描述 | 默认值 |
|:--------------------|:-----------------------------|:--------|
| security | 安全配置 | {} |
| security.basic | HTTP 基本配置 | {} |
| security.oidc | OpenID Connect 配置 | {} |
#### 基本认证
| 参数 | 描述 | 默认值 |
|:------------------------------------|:----------------------------------------------------------------------------------|:-------------|
|
security.basic | HTTP 基本配置 | {} |
| security.basic.username | 基本认证的用户名 | 必填 "" |
| security.basic.password-bcrypt-base64 | 使用 Bcrypt 哈希后再用 base64 编码的基本认证密码 | 必填 "" |下面的示例将要求您使用用户名
john.doe 和密码 hunter2 进行身份验证:security:
basic:
username: "john.doe"
password-bcrypt-base64: "JDJhJDEwJHRiMnRFakxWazZLdXBzRERQazB1TE8vckRLY05Yb1hSdnoxWU0yQ1FaYXZRSW1McmladDYu"
⚠ 请务必仔细选择 bcrypt 哈希的成本。成本越高,计算哈希所需时间越长,
而基本认证会在每次请求时验证密码与哈希是否匹配。截至2023-01-06,我建议成本设为9。
#### OIDC
| 参数 | 描述 | 默认值 |
|:---------------------------------|:-------------------------------------------------------------|:--------------|
|
security.oidc | OpenID Connect 配置 | {} |
| security.oidc.issuer-url | 签发者 URL | 必填 "" |
| security.oidc.redirect-url | 重定向 URL,必须以 /authorization-code/callback 结尾 | 必填 "" |
| security.oidc.client-id | 客户端 ID | 必填 "" |
| security.oidc.client-secret | 客户端密钥 | 必填 "" |
| security.oidc.scopes | 请求的权限范围。唯一需要的权限是 openid。 | 必填 [] |
| security.oidc.allowed-subjects | 允许的主体列表。如果为空,则允许所有主体。 | [] |security:
oidc:
issuer-url: "https://example.okta.com"
redirect-url: "https://status.example.com/authorization-code/callback"
client-id: "123456789"
client-secret: "abcdefghijk"
scopes: ["openid"]
# You may optionally specify a list of allowed subjects. If this is not specified, all subjects will be allowed.
#allowed-subjects: ["johndoe@example.com"]
Confused? Read 使用 Auth0 通过 OIDC 保护 Gatus。TLS 加密
Gatus 支持基本的 TLS 加密。要启用此功能,必须提供 PEM 格式的证书文件。下面的示例展示了一个配置示例,使 Gatus 在 4443 端口响应 HTTPS 请求:
web:
port: 4443
tls:
certificate-file: "certificate.crt"
private-key-file: "private.key"
指标
要启用指标,您必须将 metrics 设置为 true。这样会在您的应用配置运行的相同端口(web.port)的 /metrics 端点暴露 Prometheus 友好的指标。| 指标名称 | 类型 | 描述 | 标签 | 相关端点类型 |
|:---------------------------------------------|:--------|:---------------------------------------------------------------------------|:--------------------------------|:------------------------|
| gatus_results_total | 计数器 | 每个端点每个成功状态的结果数量 | key, group, name, type, success | 全部 |
| gatus_results_code_total | 计数器 | 按代码统计的结果总数 | key, group, name, type, code | DNS, HTTP |
| gatus_results_connected_total | 计数器 | 成功建立连接的结果总数 | key, group, name, type | 全部 |
| gatus_results_duration_seconds | 仪表 | 请求持续时间(秒) | key, group, name, type | 全部 |
| gatus_results_certificate_expiration_seconds | 仪表 | 证书过期剩余秒数 | key, group, name, type | HTTP, STARTTLS |
| gatus_results_endpoint_success | 仪表 | 显示端点是否成功(0 失败,1 成功) | key, group, name, type | 全部 |
参见 examples/docker-compose-grafana-prometheus 以获取更多文档及示例。
连接性
| 参数 | 描述 | 默认值 |
|:--------------------------------|:-------------------------------------------|:--------------|
| connectivity | 连接性配置 | {} |
| connectivity.checker | 连接性检查器配置 | 必填 {} |
| connectivity.checker.target | 用于验证连接性的主机 | 必填 "" |
| connectivity.checker.interval | 验证连接性的间隔 | 1m |虽然 Gatus 用于监控其他服务,但 Gatus 本身也可能失去互联网连接。
为了防止 Gatus 自身不健康时错误报告端点不健康,您可以配置
Gatus 定期检查互联网连接。
当连接性检查器判断连接不可用时,所有端点执行都会被跳过。
connectivity:
checker:
target: 1.1.1.1:53
interval: 60s
远程实例(实验性)
此功能允许您从远程 Gatus 实例检索端点状态。此功能有两个主要用例:
- 您在不同机器上运行多个 Gatus 实例,并希望通过一个仪表板直观显示状态
- 您有一个或多个 Gatus 实例无法公开访问(例如,位于防火墙后),并希望检索
这是一个实验性功能。它可能随时被删除或以破坏性方式更新。此外,
该功能存在已知问题。如果您想提供反馈,请在 #64 中发表评论。
使用风险自负。| 参数 | 描述 | 默认值 |
|:-----------------------------------|:---------------------------------------------|:--------------|
|
remote | 远程配置 | {} |
| remote.instances | 远程实例列表 | 必需 [] |
| remote.instances.endpoint-prefix | 用于为所有端点名称添加前缀的字符串 | "" |
| remote.instances.url | 用于检索端点状态的 URL | 必需 "" |remote:
instances:
- endpoint-prefix: "status.example.org-"
url: "https://status.example.org/api/v1/endpoints/statuses"
部署
许多示例可以在 .examples 文件夹中找到,但本节将重点介绍部署 Gatus 的最流行方式。Docker
使用 Docker 在本地运行 Gatus:docker run -p 8080:8080 --name gatus twinproduction/gatus
除了使用 .examples 文件夹中提供的示例之一外,您还可以通过本地创建配置文件来试用,
在此示例中,我们将其命名为
config.yaml,然后运行以下命令: docker run -p 8080:8080 --mount type=bind,source="$(pwd)"/config.yaml,target=/config/config.yaml --name gatus twinproduction/gatus
如果您使用的是 Windows,请将
"$(pwd)" 替换为您当前目录的绝对路径,例如:docker run -p 8080:8080 --mount type=bind,source=C:/Users/Chris/Desktop/config.yaml,target=/config/config.yaml --name gatus twinproduction/gatus
在本地构建镜像:
docker build . -t twinproduction/gatus
Helm 图表
必须安装 Helm 才能使用该图表。
请参阅 Helm 的文档以开始使用。Helm 设置完成后,按如下方式添加仓库:
helm repo add twin https://twin.github.io/helm-charts
helm repo update
helm install gatus twin/gatus
欲了解更多详情,请查看 chart的配置。
Terraform
Gatus 可以通过以下模块在 Terraform 上部署:terraform-kubernetes-gatus。运行测试
go test -v ./...
在生产环境中使用
请参阅部署部分。常见问题
发送GraphQL请求
通过将 endpoints[].graphql 设置为 true,body 会自动被标准的 GraphQL query 参数包裹。例如,以下配置:
endpoints:
- name: filter-users-by-gender
url: http://localhost:8080/playground
method: POST
graphql: true
body: |
{
users(gender: "female") {
id
name
gender
avatar
}
}
conditions:
- "[STATUS] == 200"
- "[BODY].data.users[0].gender == female"
将发送一个 POST 请求到 http://localhost:8080/playground,请求体如下:{"query":" {\n users(gender: \"female\") {\n id\n name\n gender\n avatar\n }\n }"}
推荐间隔
📝 如果将
disable-monitoring-lock 设置为 true,则此规则不适用,因为监控锁负责
告诉 Gatus 一次只评估一个端点。
为了确保 Gatus 提供可靠且准确的结果(即响应时间),Gatus 一次只评估一个端点。
换句话说,即使你有多个端点设置了相同的间隔,它们也不会同时执行。
你可以通过运行配置了多个端点且间隔非常短(例如 1ms,不现实)的 Gatus 来自己测试。
你会注意到响应时间不会波动——这是因为虽然端点是在不同的 goroutine 上评估的,
但有一个全局锁防止多个端点同时运行。
不幸的是,这带来一个缺点。如果你有很多端点,其中一些非常慢或容易超时
(默认超时时间为 10 秒),那么在整个请求持续时间内,其他端点无法被评估。
间隔不包括请求本身的持续时间,这意味着如果某个端点的间隔是 30 秒,
而请求完成需要 2 秒,那么两次评估之间的时间戳将是 32 秒,而不是 30 秒。
虽然这不会阻止 Gatus 对所有其他端点执行健康检查,但可能导致 Gatus 无法
遵守配置的间隔,例如:
- 端点 A 的间隔是 5 秒,且超时设置为 10 秒完成
- 端点 B 的间隔是 5 秒,且完成时间为 1 毫秒
- 端点 B 无法每 5 秒运行一次,因为端点 A 的健康评估时间超过了它的间隔
总结来说,虽然 Gatus 可以处理你设置的任何间隔,但如果请求较慢,最好设置较长的间隔。作为经验法则,我个人将复杂健康检查的间隔设置为
5m(5 分钟),
用于告警(PagerDuty/Twilio)的简单健康检查设置为 30s。默认超时
| 端点类型 | 超时 |
|:---------|:-------|
| HTTP | 10秒 |
| TCP | 10秒 |
| ICMP | 10秒 |要修改超时,请参见客户端配置。
监控 TCP 端点
通过在 endpoints[].url 前缀加上 tcp://,你可以以非常基础的方式监控 TCP 端点:endpoints:
- name: redis
url: "tcp://127.0.0.1:6379"
interval: 30s
conditions:
- "[CONNECTED] == true"
如果设置了
endpoints[].body,则会发送该内容,响应的前 1024 字节将包含在 [BODY] 中。占位符
[STATUS] 以及字段 endpoints[].headers、
endpoints[].method 和 endpoints[].graphql 不支持用于 TCP 端点。这适用于数据库(Postgres、MySQL 等)和缓存(Redis、Memcached 等)等应用。
📝
[CONNECTED] == true 并不保证端点本身是健康的——它仅保证在给定地址有
某个服务监听指定端口,并且成功建立了与该地址的连接。
监控 UDP 端点
通过在 endpoints[].url 前缀添加 udp://,您可以以非常基础的方式监控 UDP 端点:endpoints:
- name: example
url: "udp://example.org:80"
conditions:
- "[CONNECTED] == true"
如果设置了 endpoints[].body,则会发送该内容,响应的前1024字节将包含在 [BODY] 中。占位符
[STATUS] 以及字段 endpoints[].headers、
endpoints[].method 和 endpoints[].graphql 不支持用于 UDP 端点。这适用于基于 UDP 的应用程序。
监控 SCTP 端点
通过在 endpoints[].url 前加上 sctp://,您可以在非常基础的层面监控流控制传输协议(SCTP)端点:endpoints:
- name: example
url: "sctp://127.0.0.1:38412"
conditions:
- "[CONNECTED] == true"
占位符
[STATUS] 和 [BODY] 以及字段 endpoints[].body、endpoints[].headers、
endpoints[].method 和 endpoints[].graphql 不支持 SCTP 端点。 这适用于基于 SCTP 的应用。
监控 WebSocket 端点
通过在 endpoints[].url 前缀添加 ws:// 或 wss://,您可以以非常基础的方式监控 WebSocket 端点:endpoints:
- name: example
url: "wss://example.com/"
body: "status"
conditions:
- "[CONNECTED] == true"
- "[BODY].result >= 0"
[BODY] 占位符包含查询的输出,[CONNECTED]
显示连接是否成功建立。您可以使用 Go 模板
语法。可以使用 LocalAddr 和带长度的 RandomString 函数。 使用 ICMP 监控端点
通过在 endpoints[].url 前缀添加 icmp://,您可以使用 ICMP 以非常基本的方式监控端点,或更常见地称为 “ping” 或 “回显”:endpoints:
- name: ping-example
url: "icmp://example.com"
conditions:
- "[CONNECTED] == true"
仅支持占位符
[CONNECTED]、[IP] 和 [RESPONSE_TIME] 用于 ICMP 类型的端点。
您可以指定以 icmp:// 为前缀的域名,或以 icmp:// 为前缀的 IP 地址。如果您在 Linux 上运行 Gatus,请阅读 https://github.com/prometheus-community/pro-bing#linux 上的 Linux 部分,
以防遇到任何问题。
使用 DNS 查询监控端点
在端点中定义 dns 配置将自动将该端点标记为 DNS 类型的端点:endpoints:
- name: example-dns-query
url: "8.8.8.8" # Address of the DNS server to use
dns:
query-name: "example.com"
query-type: "A"
conditions:
- "[BODY] == 93.184.215.14"
- "[DNS_RCODE] == NOERROR"
有两种占位符可用于 DNS 类型端点的条件中:
- 占位符
[BODY] 解析为查询的输出。例如,类型为 A 的查询将返回一个 IPv4 地址。
占位符 [DNS_RCODE] 解析为查询返回的响应代码对应的名称,如
NOERROR、FORMERR、SERVFAIL、NXDOMAIN 等。使用 SSH 监控端点
您可以通过在 endpoints[].url 前加上 ssh:// 来使用 SSH 监控端点:endpoints:
- name: ssh-example
url: "ssh://example.com:22" # port is optional. Default is 22.
ssh:
username: "username"
password: "password"
body: |
{
"command": "uptime"
}
interval: 1m
conditions:
- "[CONNECTED] == true"
- "[STATUS] == 0"
你也可以通过不指定用户名和密码字段来使用无认证方式监控端点。endpoints:
- name: ssh-example
url: "ssh://example.com:22" # port is optional. Default is 22.
ssh:
username: ""
password: "" interval: 1m
conditions:
- "[CONNECTED] == true"
- "[STATUS] == 0"
以下占位符支持用于 SSH 类型的端点:
[CONNECTED] 如果 SSH 连接成功,则解析为 true,否则为 false
[STATUS] 解析为在远程服务器上执行命令的退出代码(例如,成功时为 0)
使用 STARTTLS 监控端点
如果您有一个电子邮件服务器,想确保其没有问题,通过 STARTTLS 进行监控
将作为一个良好的初步指示器:endpoints:
- name: starttls-smtp-example
url: "starttls://smtp.gmail.com:587"
interval: 30m
client:
timeout: 5s
conditions:
- "[CONNECTED] == true"
- "[CERTIFICATE_EXPIRATION] > 48h"
使用 TLS 监控端点
使用 SSL/TLS 加密监控端点,例如通过 TLS 的 LDAP,可以帮助检测证书过期:endpoints:
- name: tls-ldaps-example
url: "tls://ldap.example.com:636"
interval: 30m
client:
timeout: 5s
conditions:
- "[CONNECTED] == true"
- "[CERTIFICATE_EXPIRATION] > 48h"
如果设置了
endpoints[].body,则会发送该内容,响应的前1024字节将包含在 [BODY] 中。占位符
[STATUS] 以及字段 endpoints[].headers、
endpoints[].method 和 endpoints[].graphql 不支持 TLS 端点。监控域名过期
您可以使用 [DOMAIN_EXPIRATION] 占位符监控除 DNS 以外所有端点类型的域名过期情况:endpoints:
- name: check-domain-and-certificate-expiration
url: "https://example.org"
interval: 1h
conditions:
- "[DOMAIN_EXPIRATION] > 720h"
- "[CERTIFICATE_EXPIRATION] > 240h"
> ⚠ 使用 [DOMAIN_EXPIRATION] 占位符需要 Gatus 发送请求到官方 IANA WHOIS 服务 通过一个库
并且在某些情况下,需要向特定顶级域 WHOIS 服务器发送二次请求(例如
whois.nic.sh)。
为防止 WHOIS 服务因请求过多而限制您的 IP 地址,Gatus 会阻止您在间隔少于
5m 的端点上使用
[DOMAIN_EXPIRATION] 占位符。disable-monitoring-lock
将 disable-monitoring-lock 设置为 true 意味着多个端点可以同时被监控(即并行执行)。虽然这种行为通常不会有害,但使用
[RESPONSE_TIME] 占位符的条件可能会受到
同时评估多个端点的影响,因此,该参数的默认值为 false。您可能想禁用监控锁的三个主要原因:
- 您使用 Gatus 进行负载测试(每个端点都会周期性在不同的 goroutine 上评估,因此
技术上,如果您创建了 100 个间隔为 1 秒的端点,Gatus 将每秒发送 100 个请求)
- 您有大量端点需要监控
- 您希望在非常短的间隔内(< 5秒)测试多个端点
动态重新加载配置
为了方便起见,如果在 Gatus 运行时加载的配置文件被更新,Gatus 会自动动态重新加载配置。默认情况下,如果更新的配置无效,应用程序将退出,但您可以通过
将
skip-invalid-config-update 设置为 true 来配置
Gatus 在配置文件更新为无效配置时继续运行。请记住,您最好在每次更新配置文件时确保配置文件的有效性,
通过查看日志并确保没有看到以下消息:
The configuration file was updated, but it is not valid. The old configuration will continue being used.
未能做到这一点可能导致如果应用程序因某种原因重新启动,Gatus 无法启动。我建议不要将
skip-invalid-config-update 设置为 true,以避免出现这种情况,但选择权在于您。如果您不使用文件存储,在 Gatus 运行时更新配置实际上
等同于重新启动应用程序。
📝 如果配置文件被绑定而不是配置文件夹,更新可能无法被检测到。详见 #151。
端点组
端点组用于在仪表板上将多个端点分组显示。endpoints:
- name: frontend
group: core
url: "https://example.org/"
interval: 5m
conditions:
- "[STATUS] == 200"
- name: backend
group: core
url: "https://example.org/"
interval: 5m
conditions:
- "[STATUS] == 200"
- name: monitoring
group: internal
url: "https://example.org/"
interval: 5m
conditions:
- "[STATUS] == 200"
- name: nas
group: internal
url: "https://example.org/"
interval: 5m
conditions:
- "[STATUS] == 200"
- name: random endpoint that is not part of a group
url: "https://example.org/"
interval: 5m
conditions:
- "[STATUS] == 200"
上述配置将生成如下所示的仪表板: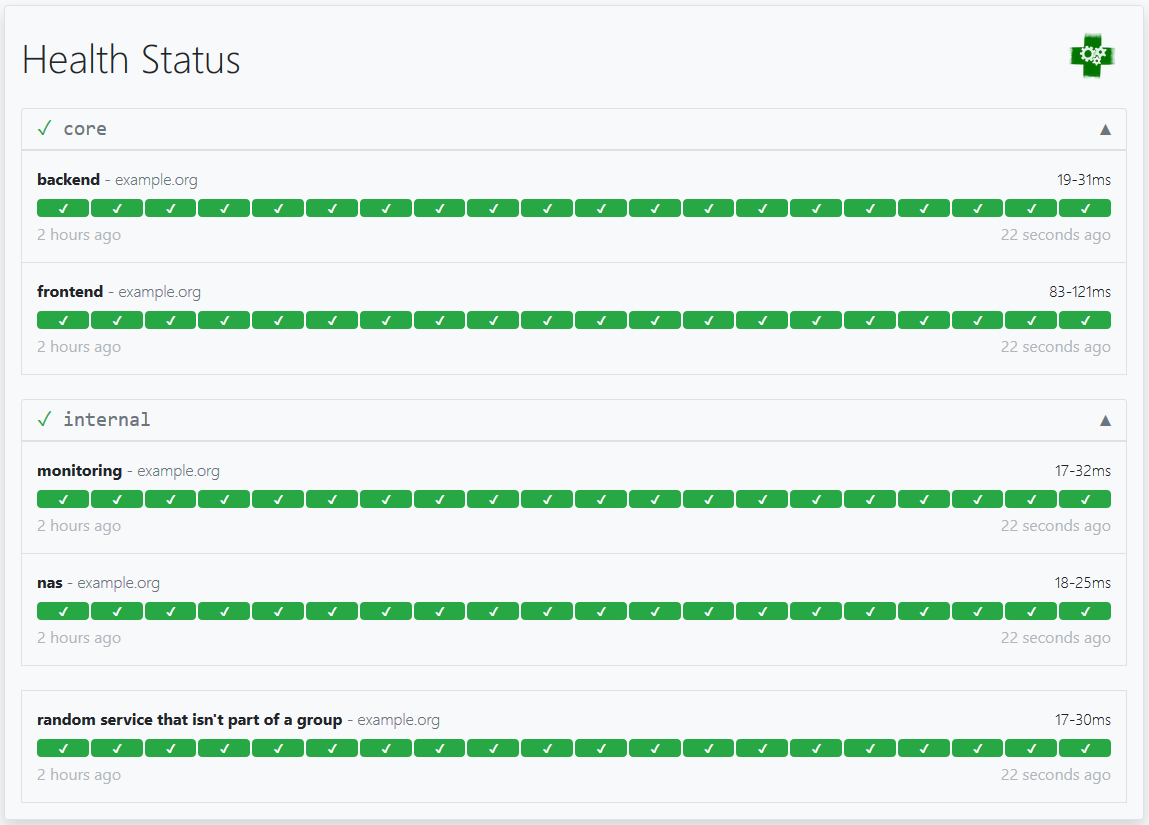
在自定义路径上暴露 Gatus
目前,您可以使用完全限定域名(FQDN)如 status.example.org 来暴露 Gatus UI。但是,它不支持基于路径的路由,这意味着您无法通过像 example.org/status/ 这样的 URL 来暴露它。更多信息,请参见 https://github.com/TwiN/gatus/issues/88。
在自定义端口上暴露 Gatus
默认情况下,Gatus 暴露在端口 8080 上,但您可以通过设置 web.port 参数来指定不同的端口:web:
port: 8081
如果您使用的是像 Heroku 这样的 PaaS,它不允许您设置自定义端口,而是通过环境变量暴露端口,
您可以直接在配置文件中使用该环境变量:
web:
port: ${PORT}
配置启动延迟
如果出于任何原因,您需要 Gatus 在应用启动时等待一段时间再开始监控端点,可以使用 GATUS_DELAY_START_SECONDS 环境变量让 Gatus 在启动时休眠。 保持配置简洁
虽然这不是 Gatus 特有的功能,但您可以利用 YAML 锚点来创建默认配置。
如果您的配置文件较大,这将有助于保持配置的整洁。
示例
default-endpoint: &defaults
group: core
interval: 5m
client:
insecure: true
timeout: 30s
conditions:
- "[STATUS] == 200"
endpoints:
- name: anchor-example-1
<<: *defaults # This will merge the configuration under &defaults with this endpoint
url: "https://example.org"- name: anchor-example-2
<<: *defaults
group: example # This will override the group defined in &defaults
url: "https://example.com"- name: anchor-example-3
<<: *defaults
url: "https://twin.sh/health"
conditions: # This will override the conditions defined in &defaults
- "[STATUS] == 200"
- "[BODY].status == UP"
代理客户端配置
您可以通过在客户端配置中设置 proxy-url 参数来配置客户端使用的代理。endpoints:
- name: website
url: "https://twin.sh/health"
client:
proxy-url: http://proxy.example.com:8080
conditions:
- "[STATUS] == 200"
如何修复 431 请求头字段过大错误
根据您的环境部署位置以及位于 Gatus 前的中间件或反向代理类型,
您可能会遇到此问题。这可能是因为请求头过大,例如大容量的 Cookie。默认情况下,
web.read-buffer-size 设置为 8192,但通过如下方式增加此值将增大读取缓冲区大小:web:
read-buffer-size: 32768
徽章
#### 运行时间


Gatus 可以自动为您监控的端点之一生成 SVG 徽章。
这使您可以将徽章放入各自应用程序的 README 文件中,甚至如果您愿意,还可以创建自己的状态页面。
生成徽章的路径如下:
/api/v1/endpoints/{key}/uptimes/{duration}/badge.svg
其中:
{duration} 是 30d、7d、24h 或 1h
{key} 的格式为 ,其中两个变量中的 、/、_、,、. 和 # 均替换为 -。例如,如果您想获取来自组
core 中端点 frontend 的过去 24 小时的正常运行时间,
则 URL 如下所示:https://example.com/api/v1/endpoints/core_frontend/uptimes/7d/badge.svg
如果您想显示不属于任何组的端点,必须将组值留空:
https://example.com/api/v1/endpoints/_frontend/uptimes/7d/badge.svg
示例:
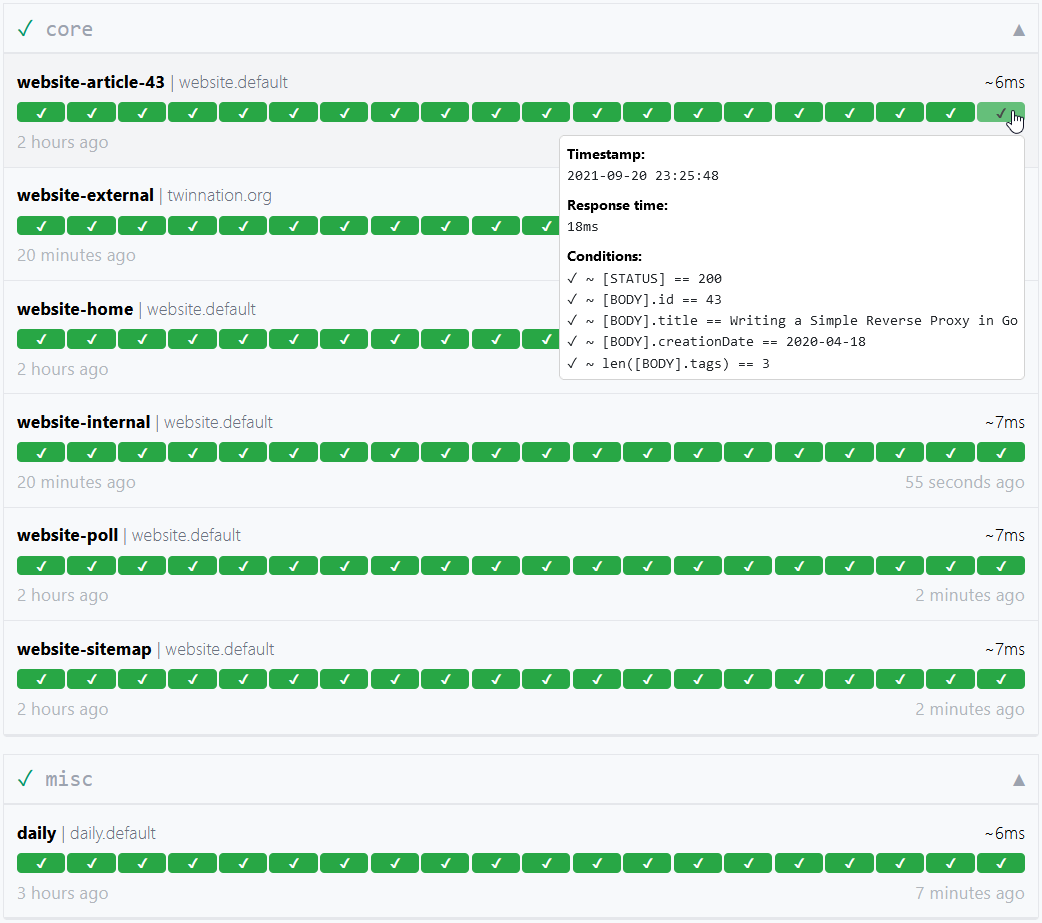
如果您想查看每个徽章的视觉示例,只需导航到端点的详细页面即可。
#### 健康

生成徽章的路径如下:
/api/v1/endpoints/{key}/health/badge.svg
Where:
{key} 的模式是 ,其中两个变量中的 、/、_、,、. 和 # 都被替换为 -。例如,如果您想获取组
core 中端点 frontend 的当前状态,
URL 看起来会是这样:https://example.com/api/v1/endpoints/core_frontend/health/badge.svg
#### 健康状况(Shields.io)

生成徽章的路径如下:
/api/v1/endpoints/{key}/health/badge.shields
其中:
{key} 的模式为 ,其中两个变量中的 、/、_、,、. 和 # 都被替换为 -。例如,如果您想获取组
core 中端点 frontend 的当前状态,
URL 将如下所示:https://example.com/api/v1/endpoints/core_frontend/health/badge.shields
See more information about the Shields.io badge endpoint here.
#### Response time


The endpoint to generate a badge is the following:
/api/v1/endpoints/{key}/response-times/{duration}/badge.svg
Where:
{duration} 是 30d、7d、24h 或 1h
{key} 的格式为 ,其中两个变量的 、/、_、,、. 和 # 均替换为 -#### 响应时间(图表)


生成响应时间图表的端点如下:
/api/v1/endpoints/{key}/response-times/{duration}/chart.svg
Where:
是 30d、7d 或 24h
{key} 的模式为 ,其中两个变量中的 、/、_、,、. 和 # 均被替换为 -。 ##### 如何更改响应时间徽章的颜色阈值
要更改响应时间徽章的阈值,可以向端点添加相应的配置。
数组中的值对应级别 [Awesome, Great, Good, Passable, Bad]
所有五个值必须以毫秒(ms)为单位给出。
endpoints:
- name: nas
group: internal
url: "https://example.org/"
interval: 5m
conditions:
- "[STATUS] == 200"
ui:
badge:
response-time:
thresholds: [550, 850, 1350, 1650, 1750]
API
Gatus 提供了一个简单的只读 API,可以通过该 API 以编程方式确定端点状态和历史。所有端点都可以通过对以下端点的 GET 请求获得:
/api/v1/endpoints/statuses
示例:https://status.twin.sh/api/v1/endpoints/statuses
也可以使用以下模式查询特定的端点:
/api/v1/endpoints/{group}_{endpoint}/statuses如果 Accept-Encoding HTTP 头包含 gzip,则会使用 Gzip 压缩。
API 将返回一个 JSON 负载,Content-Type 响应头设置为 application/json。
查询 API 不需要该头。
#### 原始数据 Gatus 会暴露您监控的某个端点的原始数据。 这允许您在自己的应用程序中跟踪和汇总监控端点的数据。例如,如果您想跟踪超过 7 天的正常运行时间。
##### 正常运行时间 获取端点原始正常运行时间数据的路径是:
/api/v1/endpoints/{key}/uptimes/{duration}{duration}是30d、7d、24h或1h{key}的格式为_ /、_、,、.和#均被替换为-。
core 中端点 frontend 最近 24 小时的原始正常运行时间数据,URL 将如下所示:
https://example.com/api/v1/endpoints/core_frontend/uptimes/24h/api/v1/endpoints/{key}/response-times/{duration}{duration}是30d、7d、24h或1h{key}的格式为_ /、_、,、.和#都被替换为-。
core 中端点 frontend 最近 24 小时的原始响应时间数据,URL 看起来会是这样:https://example.com/api/v1/endpoints/core_frontend/response-times/24h作为二进制文件安装
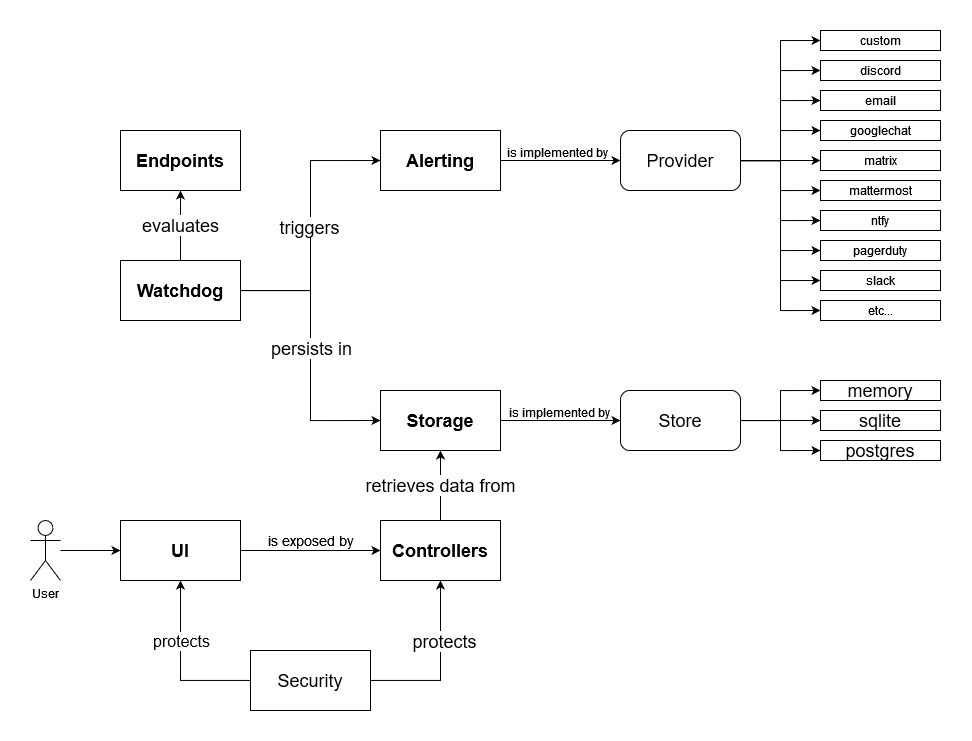
您可以使用以下命令下载 Gatus 二进制文件:go install github.com/TwiN/gatus/v5@latestHigh level design overview
--- Tranlated By Open Ai Tx | Last indexed: 2025-07-23 ---