VIGIL
Monitor de energía en tiempo real para terminal — CPU · GPU · RAM · Red · Procesos




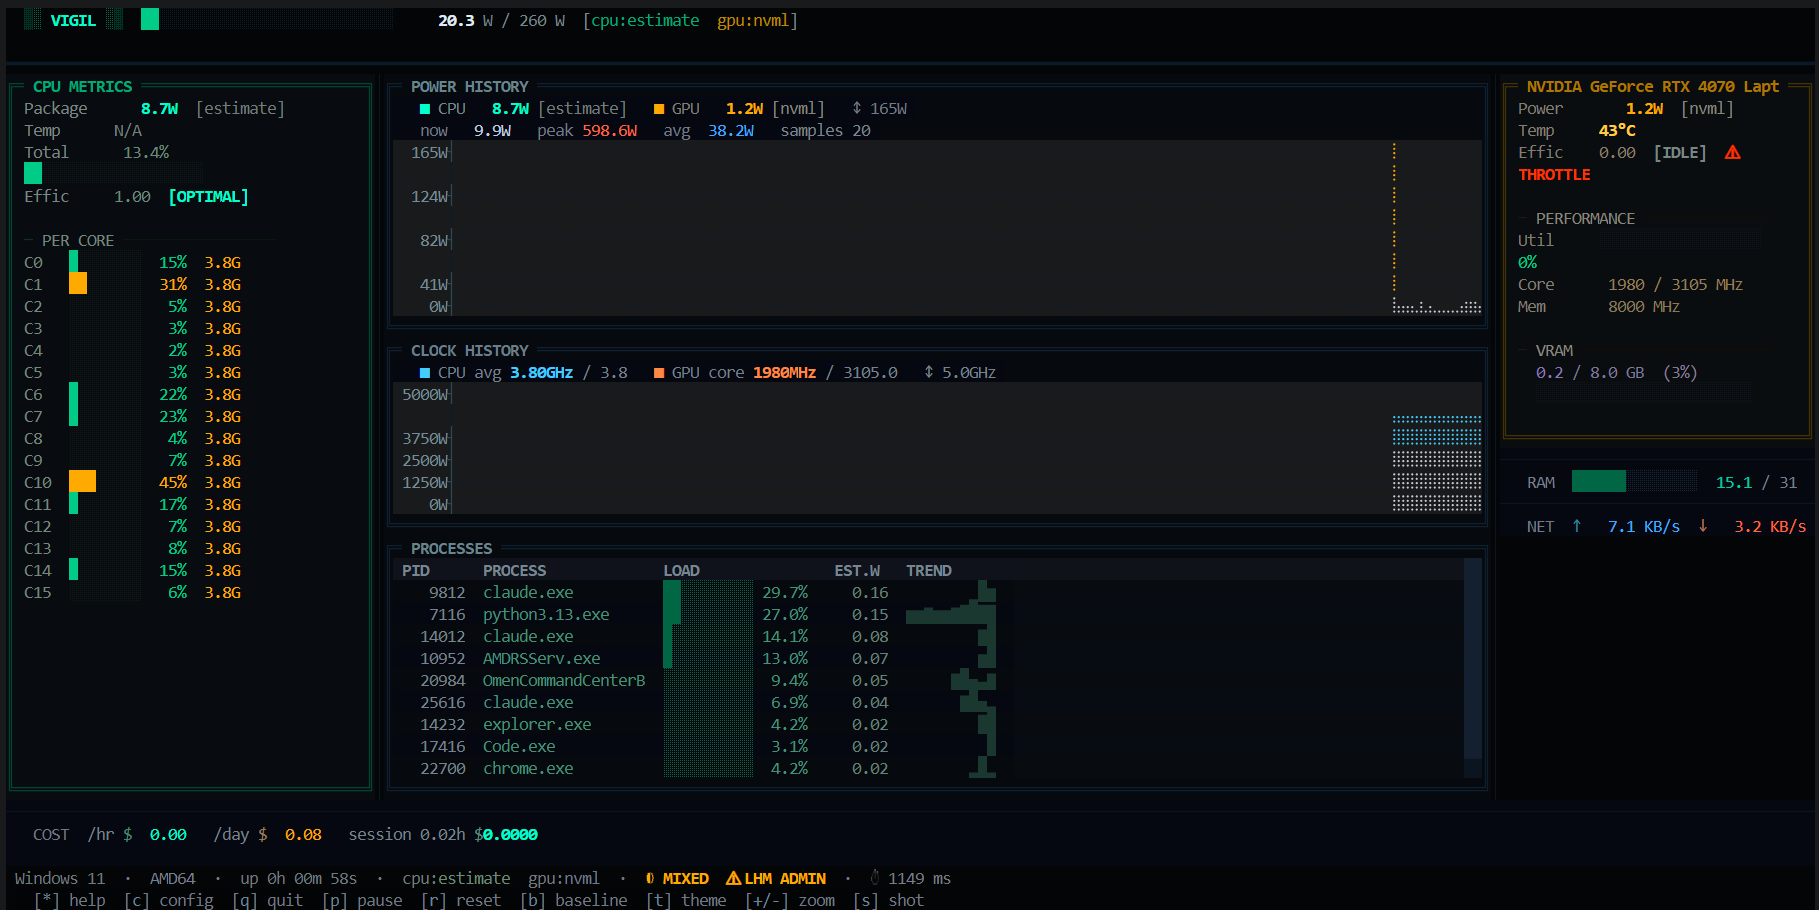
Descripción general
vigil es un panel de control de alta resolución para terminal que muestra consumo en vatios en vivo, temperaturas, velocidades de reloj, puntuaciones de eficiencia y costo de electricidad para cada componente principal — todo dentro de la terminal sin navegador, sin servicio en segundo plano, sin telemetría.
Lee directamente de sensores de hardware (hwmon, RAPL, LibreHardwareMonitor, NVML) y se adapta con gracia cuando un sensor no está disponible. Cada panel se actualiza en tiempo real, todo funciona con un solo comando vigil.
Características
Energía y temperaturas
- Potencia del paquete CPU — hwmon (k10temp / zenpower / amd_energy) → RAPL → LibreHardwareMonitor WMI → CPU% × estimación de TDP
- Potencia GPU — NVIDIA NVML: vatios, temperatura, utilización, relojes núcleo/memoria, VRAM, velocidad del ventilador
- Consumo RAM — modelo de potencia DDR4 (cantidad de ranuras × utilización)
- Detección de estrangulamiento — insignia parpadeante
THROTTLEen estrangulamiento térmico de CPU o GPU
Gráficos y visualización
- Historial de potencia — gráfico de área Braille de alta resolución, superposición CPU + GPU
- Historial de reloj — frecuencia media CPU + reloj núcleo GPU con marcador de techo de boost
- Barras por núcleo — % de utilización + frecuencia en vivo para cada núcleo
Inteligencia de Procesos
- Tabla de procesos — clasificada por contribución estimada de vatios
- Tendencias sparkline — mini gráfico histórico de vatios por proceso
- Columna EST.W — vatios por proceso derivados del % de CPU del paquete
Eficiencia y Costos
- Puntuación de eficiencia —
OPTIMAL·NORMAL·LOW EFF·THROTTLE - Costo de electricidad — /hora, /día, total sesión (precio kWh + moneda configurable)
- Modo base — instantánea en estado inactivo, compara delta en tiempo real
Alertas y Registro
- Alertas webhook — POST HTTP cuando se supera temperatura o umbral de potencia CPU
- Registro de sesión — log opcional JSONL por tick (
--logflag) - Captura SVG — exportación completa del panel con
s
Temas y UX
- TacticalCyberpunk (oscuro) — verde / ámbar / cian sobre casi negro
- GhostWhite (claro) — monocromo de alto contraste
- Asistente de configuración — primera ejecución con configuración guiada de TDP + kWh
- Recoloración en vivo — ajustes de color en la barra lateral sin reinicio
Soporte de Plataforma
| Plataforma | Potencia CPU | Temp. CPU | Potencia GPU | Temp. GPU | |---|---|---|---|---| | Linux | hwmon · RAPL · estimación | hwmon | NVML | NVML | | Windows 11 / 10 | LibreHardwareMonitor · estimación | LHM | NVML | NVML | | macOS | solo estimación | — | NVML (si está presente) | NVML |
Windows — lecturas precisas de CPU
vigil lee el consumo real de vatios de la CPU mediante LibreHardwareMonitor (MPL-2.0) a través de su interfaz WMI. Sin él, vigil recurre automáticamente a una estimación de % CPU × TDP.
- Descargue LibreHardwareMonitor
- Ejecute como Administrador
- Inicie vigil — LHM se detecta automáticamente
Installation
Requirements: Python 3.11+
# Clone
git clone https://github.com/GIN-SYSTEMS/vigil-tui
cd vigil-tuiLinux / macOS
pip install .Windows (includes WMI + pywin32 for LHM support)
pip install ".[windows]"
Run:
vigil           # launch dashboard
vigil --log     # launch + write JSONL tick log
vigil --help    # all options
Atajos de Teclado
| Tecla | Acción |
|-------|--------|
| * / ? | Alternar superposición de ayuda |
| q / Ctrl+C | Salir |
| p | Pausar / reanudar muestreo |
| r | Reiniciar historial del gráfico |
| + / - | Acercar / alejar eje Y |
| b | Capturar línea base — presionar de nuevo para borrar |
| s | Guardar captura SVG |
| t | Cambiar tema (oscuro ↔ claro) |
| c | Abrir configuración / asistente de configuración |
Configuración
El primer lanzamiento crea ~/.config/vigil/config.toml:
[hardware]
cpu_tdp_watts = 65.0 # CPU TDP ceiling for estimation
gpu_tdp_watts = 165.0 # GPU TDP ceiling
update_interval = 1.0 # seconds between ticks
history_len = 120 # chart ring-buffer depth[cost]
kwh_price = 2.0 # electricity price per kWh
currency_symbol = "₺"
[alerts]
webhook_url = "" # HTTP POST endpoint — empty = disabled
cpu_temp_thresh = 90 # °C
cpu_watt_thresh_pct = 90 # % of TDP
[ui]
theme = "tactical" # "tactical" or "ghost"
How the power waterfall works
vigil starts
│
├─ Linux?
│   ├─ hwmon sysfs (k10temp / zenpower / amd_energy)   ← real sensor
│   ├─ RAPL powercap energy_uj delta                   ← kernel counter
│   └─ CPU% × TDP estimate                             ← always available
│
└─ Windows?
    ├─ LibreHardwareMonitor WMI (requires Admin + LHM) ← real sensor
    └─ CPU% × TDP estimate                             ← always availableGPU → NVML (pynvml) on all platforms
     if no NVIDIA GPU: panel shows "unavailable", no crash
Project Structure
vigil-tui/
├── src/vigil/
│   ├── app.py                   # Textual app, layout, tick loop
│   ├── config.py                # Static constants
│   ├── config_manager.py        # TOML config loader/writer
│   ├── session.py               # Cost tracking, webhooks, JSONL logging
│   ├── collectors/
│   │   ├── base.py              # Collector ABC + SensorReading
│   │   ├── cpu.py               # hwmon → RAPL → LHM → estimate
│   │   ├── gpu.py               # NVIDIA NVML
│   │   ├── ram.py               # RAM wattage model
│   │   ├── netdisk.py           # Network + disk I/O rates
│   │   └── system.py            # Orchestrator → SystemSnapshot
│   └── widgets/
│       ├── power_header.py      # Top bar: wordmark + gauge
│       ├── cpu_panel.py         # Left: CPU + per-core bars
│       ├── braille_chart.py     # Center: power history
│       ├── clock_chart.py       # Center: clock history
│       ├── process_table.py     # Center: process ranking
│       ├── gpu_panel.py         # Right: GPU metrics
│       ├── financial_widget.py  # Cost display
│       ├── netdisk_widget.py    # Network + disk rates
│       ├── status_bar.py        # Footer
│       ├── boot_screen.py       # Splash screen
│       ├── help_overlay.py      # Key bindings overlay
│       └── setup_wizard.py      # First-run wizard
├── .github/workflows/ci.yml
├── pyproject.toml
├── requirements.txt
└── LICENSE
Dependencias
| Paquete | Propósito |
|---------|---------|
| textual >= 0.80 | Framework TUI |
| psutil >= 5.9.8 | CPU%, lista de procesos, I/O de red/disco |
| pynvml >= 11.5.0 | Métricas de GPU NVIDIA |
| wmi >= 1.5.1 (Windows) | Puente WMI de LHM |
| pywin32 >= 306 (Windows) | Soporte COM/WMI de Windows |
Licencia
MIT — libre para usar, modificar y distribuir.
--- Tranlated By Open Ai Tx | Last indexed: 2026-07-17 ---