VIGIL
Real-time terminal power monitor — CPU · GPU · RAM · Network · Processes




Overview
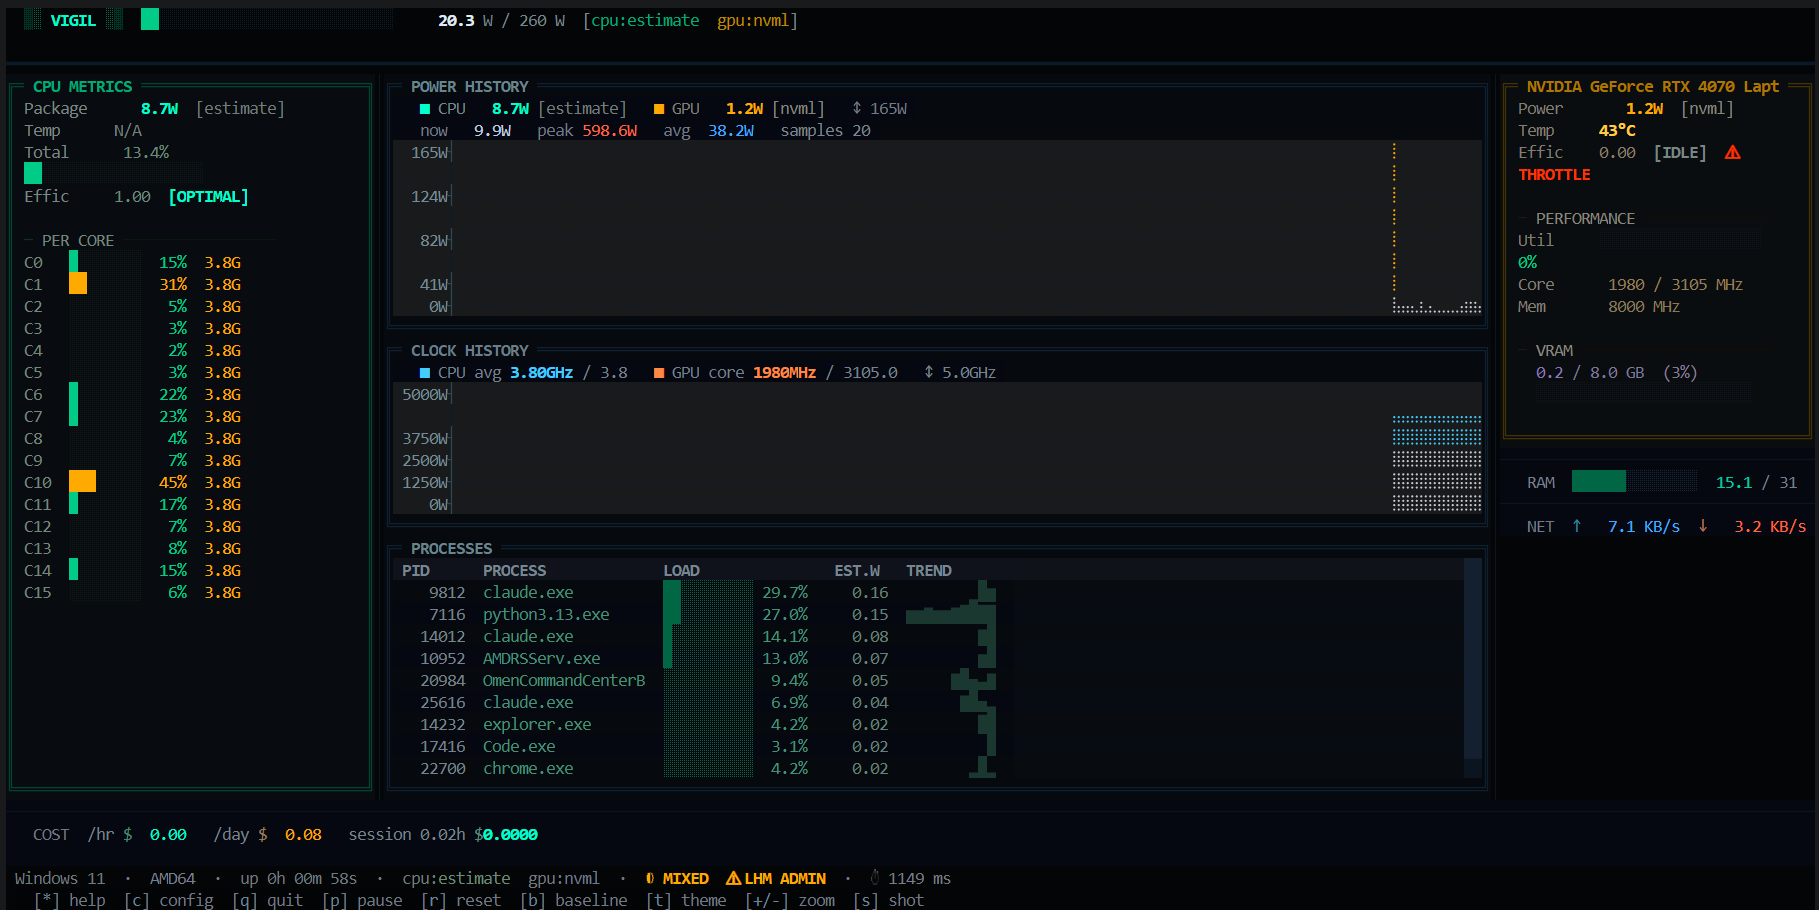
vigil is a high-resolution terminal dashboard that shows live wattage, thermals, clock speeds, efficiency scores, and electricity cost for every major component — all inside the terminal with no browser, no background service, no telemetry.
It reads directly from hardware sensors (hwmon, RAPL, LibreHardwareMonitor, NVML) and falls back gracefully when a sensor is unavailable. Every panel updates in real time, the whole thing runs from a single vigil command.
Features
Power & Thermals
- CPU package power — hwmon (k10temp / zenpower / amd_energy) → RAPL → LibreHardwareMonitor WMI → CPU% × TDP estimate
- GPU power — NVIDIA NVML: watts, temperature, utilisation, core/mem clocks, VRAM, fan speed
- RAM wattage — DDR4 power model (slot count × utilisation)
- Throttle detection — blinking
THROTTLEbadge on CPU or GPU thermal throttle
Charts & Visualisation
- Power history — high-resolution Braille area chart, CPU + GPU overlay
- Clock history — CPU avg frequency + GPU core clock with boost ceiling marker
- Per-core bars — utilisation % + live frequency for every core
Process Intelligence
- Process table — ranked by estimated wattage contribution
- Sparkline trends — per-process watt history mini-chart
- EST.W column — watts per process derived from CPU% share of package power
Efficiency & Cost
- Efficiency score —
OPTIMAL·NORMAL·LOW EFF·THROTTLE - Electricity cost — /hr, /day, session total (configurable kWh price + currency)
- Baseline mode — snapshot idle state, compare live delta in real time
Alerts & Logging
- Webhook alerts — HTTP POST when CPU temp or power threshold is breached
- Session logging — optional JSONL tick log (
--logflag) - SVG screenshot — full dashboard export with
s
Themes & UX
- TacticalCyberpunk (dark) — green / amber / cyan on near-black
- GhostWhite (light) — high-contrast monochrome
- Setup wizard — first-run guided TDP + kWh configuration
- Live accent recolour — sidebar colour tweaks without restart
Platform Support
| Platform | CPU Power | CPU Temp | GPU Power | GPU Temp | |---|---|---|---|---| | Linux | hwmon · RAPL · estimate | hwmon | NVML | NVML | | Windows 11 / 10 | LibreHardwareMonitor · estimate | LHM | NVML | NVML | | macOS | estimate only | — | NVML (if present) | NVML |
Windows — accurate CPU readings
vigil reads real CPU wattage through LibreHardwareMonitor (MPL-2.0) via its WMI interface. Without it, vigil falls back to a CPU% × TDP estimate automatically.
- Download LibreHardwareMonitor
- Run it as Administrator
- Launch vigil — LHM is detected automatically
Installation
Requirements: Python 3.11+
# Clone
git clone https://github.com/GIN-SYSTEMS/vigil-tui
cd vigil-tuiLinux / macOS
pip install .Windows (includes WMI + pywin32 for LHM support)
pip install ".[windows]"
Run:
vigil           # launch dashboard
vigil --log     # launch + write JSONL tick log
vigil --help    # all options
Key Bindings
| Key | Action |
|-----|--------|
| * / ? | Toggle help overlay |
| q / Ctrl+C | Quit |
| p | Pause / resume sampling |
| r | Reset chart history |
| + / - | Zoom Y-axis in / out |
| b | Snapshot baseline — press again to clear |
| s | Save SVG screenshot |
| t | Toggle theme (dark ↔ light) |
| c | Open config / setup wizard |
Configuration
First launch creates ~/.config/vigil/config.toml:
[hardware]
cpu_tdp_watts = 65.0 # CPU TDP ceiling for estimation
gpu_tdp_watts = 165.0 # GPU TDP ceiling
update_interval = 1.0 # seconds between ticks
history_len = 120 # chart ring-buffer depth[cost]
kwh_price = 2.0 # electricity price per kWh
currency_symbol = "₺"
[alerts]
webhook_url = "" # HTTP POST endpoint — empty = disabled
cpu_temp_thresh = 90 # °C
cpu_watt_thresh_pct = 90 # % of TDP
[ui]
theme = "tactical" # "tactical" or "ghost"
How the power waterfall works
vigil starts
│
├─ Linux?
│   ├─ hwmon sysfs (k10temp / zenpower / amd_energy)   ← real sensor
│   ├─ RAPL powercap energy_uj delta                   ← kernel counter
│   └─ CPU% × TDP estimate                             ← always available
│
└─ Windows?
    ├─ LibreHardwareMonitor WMI (requires Admin + LHM) ← real sensor
    └─ CPU% × TDP estimate                             ← always availableGPU → NVML (pynvml) on all platforms
     if no NVIDIA GPU: panel shows "unavailable", no crash
Project Structure
vigil-tui/
├── src/vigil/
│   ├── app.py                   # Textual app, layout, tick loop
│   ├── config.py                # Static constants
│   ├── config_manager.py        # TOML config loader/writer
│   ├── session.py               # Cost tracking, webhooks, JSONL logging
│   ├── collectors/
│   │   ├── base.py              # Collector ABC + SensorReading
│   │   ├── cpu.py               # hwmon → RAPL → LHM → estimate
│   │   ├── gpu.py               # NVIDIA NVML
│   │   ├── ram.py               # RAM wattage model
│   │   ├── netdisk.py           # Network + disk I/O rates
│   │   └── system.py            # Orchestrator → SystemSnapshot
│   └── widgets/
│       ├── power_header.py      # Top bar: wordmark + gauge
│       ├── cpu_panel.py         # Left: CPU + per-core bars
│       ├── braille_chart.py     # Center: power history
│       ├── clock_chart.py       # Center: clock history
│       ├── process_table.py     # Center: process ranking
│       ├── gpu_panel.py         # Right: GPU metrics
│       ├── financial_widget.py  # Cost display
│       ├── netdisk_widget.py    # Network + disk rates
│       ├── status_bar.py        # Footer
│       ├── boot_screen.py       # Splash screen
│       ├── help_overlay.py      # Key bindings overlay
│       └── setup_wizard.py      # First-run wizard
├── .github/workflows/ci.yml
├── pyproject.toml
├── requirements.txt
└── LICENSE
Dependencies
| Package | Purpose |
|---------|---------|
| textual >= 0.80 | TUI framework |
| psutil >= 5.9.8 | CPU%, process list, net/disk I/O |
| pynvml >= 11.5.0 | NVIDIA GPU metrics |
| wmi >= 1.5.1 (Windows) | LHM WMI bridge |
| pywin32 >= 306 (Windows) | Windows COM/WMI support |
License
MIT — free to use, modify, and distribute.
--- Tranlated By Open Ai Tx | Last indexed: 2026-07-17 ---