🌐 语言
matplot2tikz
前称 tikzplotlib。


![]()
![]()
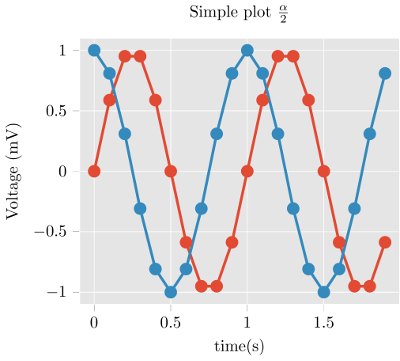
这是 matplot2tikz,一个用于将 matplotlib 图形转换为 PGFPlots(PGF/TikZ) 图形的 Python 工具,例如
可以原生嵌入到 LaTeX 或 ConTeXt 文档中。
matplot2tikz 的输出采用 PGFPlots,它是一个 TeX 库,构建在 PGF/TikZ 之上, 以坐标轴、数据等方式描述图形。因此,matplot2tikz 的输出
- 保留了更多信息,
- 更容易被理解,并且
- 更方便编辑
import matplotlib.pyplot as plt
import numpy as npplt.style.use("ggplot")
t = np.arange(0.0, 2.0, 0.1)
s = np.sin(2 np.pi t)
s2 = np.cos(2 np.pi t)
plt.plot(t, s, "o-", lw=4.1)
plt.plot(t, s2, "o-", lw=4.1)
plt.xlabel("time (s)")
plt.ylabel("Voltage (mV)")
plt.title("Simple plot $\\frac{\\alpha}{2}$")
plt.grid(True)
import matplot2tikz
matplot2tikz.save("test.tex")
--> (see above) gives
\begin{tikzpicture}\definecolor{chocolate2267451}{RGB}{226,74,51}
\definecolor{dimgray85}{RGB}{85,85,85}
\definecolor{gainsboro229}{RGB}{229,229,229}
\definecolor{steelblue52138189}{RGB}{52,138,189}
\begin{axis}[
axis background/.style={fill=gainsboro229},
axis line style={white},
tick align=outside,
tick pos=left,
title={Simple plot \(\displaystyle \frac{\alpha}{2}\)},
x grid style={white},
xlabel=\textcolor{dimgray85}{time (s)},
xmajorgrids,
xmin=-0.095, xmax=1.995,
xtick style={color=dimgray85},
y grid style={white},
ylabel=\textcolor{dimgray85}{Voltage (mV)},
ymajorgrids,
ymin=-1.1, ymax=1.1,
ytick style={color=dimgray85}
]
\addplot [line width=1.64pt, chocolate2267451, mark=*, mark size=3, mark options={solid}]
table {%
0 0
% [...]
1.9 -0.587785252292473
};
\addplot [line width=1.64pt, steelblue52138189, mark=*, mark size=3, mark options={solid}]
table {%
0 1
% [...]
1.9 0.809016994374947
};
\end{axis}
\end{tikzpicture}
get_tikz_code() 而不是 save()。)调整图表非常简单,可以作为你的 TeX 工作流程的一部分完成。 精彩的 PGFPlots 手册 包含 许多如何让你的图表看起来更好的优秀示例。
当然,并非所有由 matplotlib 生成的图形都能无误转换。 尤其是,三维图形无法工作。
安装
matplot2tikz 可从 Python 包索引 获取, 所以只需执行
pip install matplot2tikz安装。
用法
- 像往常一样生成你的 matplotlib 图表。
- 不要使用
pyplot.show(),而是调用 matplot2tikz 来
python
    import matplot2tikz    matplot2tikz.save("mytikz.tex")
    # or
    matplot2tikz.save("mytikz.tex", flavor="context")
` 将 TikZ 文件保存为
。- 将
mytikz.tex 的内容添加到您的 TeX 源代码中。一个方便的方法是通过
使用
`latex
\input{/path/to/mytikz}
` 还要确保在文档的头部包含 PGFPlots 和适当的 Unicode 支持包:
latex
    \usepackage[utf8]{inputenc}
    \usepackage{pgfplots}
    \DeclareUnicodeCharacter{2212}{−}
    \usepgfplotslibrary{groupplots,dateplot}
    \usetikzlibrary{patterns,shapes.arrows}
    \pgfplotsset{compat=newest}
` or:
latex
    \setupcolors[state=start]
    \usemodule[tikz]
    \usemodule[pgfplots]
    \usepgfplotslibrary[groupplots,dateplot]
    \usetikzlibrary[patterns,shapes.arrows]
    \pgfplotsset{compat=newest}
    \unexpanded\def\startgroupplot{\groupplot}
    \unexpanded\def\stopgroupplot{\endgroupplot}
`
您也可以通过以下方式获取代码:
`python
import matplot2tikz matplot2tikz.Flavors.latex.preamble()
# or
matplot2tikz.Flavors.context.preamble()
`- [可选] 在导出到 tikz 之前,使用
命令清理图形。
`python
import matplotlib.pyplot as plt
import numpy as np # ... do your plotting
import matplot2tikz
matplot2tikz.clean_figure()
matplot2tikz.save("test.tex")
`
该命令将移除轴限制之外的点,简化曲线并
降低指定目标分辨率的点密度。matplot2tikz 与 tikzplotlib
该 matplot2tikz 库起源于 tikzplotlib
项目。
创建新库的原因是 tikzplotlib 不再维护,
且维护只能由 tikzplotlib 库的唯一所有者完成。
如果您需要使用已依赖 tikzplotlib 的第三方代码,建议将
tikzplotlib 依赖更改为 matplot2tikz。
如果无法更改,解决方法是在导入
第三方代码之前放置以下代码:
`
   import sys
   import matplot2tikz
   sys.modules["tikzplotlib"] = matplot2tikz
   # Do other imports, e.g., using
import my_third_party_library
# If tikzplotlib is used in this library, it will automatically use matplot2tikz instead.
`
如果您正在从 tikzplotlib 更新自己的脚本,您可以简单地使用导入别名:
`python
import matplot2tikz as tikzplotlib
`贡献
如果您遇到错误,想要贡献代码,有matplot2tikz的优秀示例,或者只是想了解更多信息,请访问
matplot2tikz的GitHub页面。
贡献步骤如下:
- 下载git仓库,例如使用
。
- 创建虚拟环境,例如使用
python -m venv venv。
激活虚拟环境(例如,在Windows上,使用 venv\Scripts\activate)。
使用 pip install uv 安装 uv,然后使用 uv pip install tox-uv 安装 tox-uv。
主分支是受保护的,意味着您不能直接向该分支推送更改。
因此,如果您想做更改,请在一个单独的分支上进行。例如,您可以使用
git checkout -b feature/my_awesome_new_feature 创建一个新分支。
- 在推送更改之前,确保代码符合代码风格检查规则且测试全部通过。
运行 tox。这将执行代码风格检查并运行所有测试脚本。要手动执行这些步骤,请使用以下命令:
- 运行
tox -e lint。您也可以手动执行代码风格检查命令:
(一次性) uv pip install -r requirements-lint.txt
ruff format . --check(去掉 --check 标志可让 ruff 自动格式化代码)
ruff check .
mypy .
运行 tox -e py310。
运行 tox -e py311。
运行 tox -e py312。
运行 tox -e py313。
运行 tox -e py314。
运行 tox -e combine-test-reports
使用
/reports/coverage_html/index.html 中的覆盖率报告检查测试是否覆盖所有内容。 注意:目前并非所有代码都被覆盖。理想情况下,应覆盖所有代码,但现在请确保
所有新代码都被测试覆盖。
- 将更改推送到GitHub。如果一切正常并且您想将更改合并到
main
   分支,请创建一个拉取请求。
   理想情况下,应至少有一位审阅者在合并之前审查该拉取请求。请注意,目前只有“代码所有者”可以将拉取请求合并到
main` 分支。这样做是为了
确保并非所有人都能破坏主代码(即使是无意的)。如果你想成为“代码所有者”,请告诉我们!许可证
matplot2tikz 以 MIT 许可证 发布。
--- Tranlated By Open Ai Tx | Last indexed: 2026-04-04 ---