🌐 언어
matplot2tikz
이전 명칭 tikzplotlib로 알려진 아티스트.


![]()
![]()
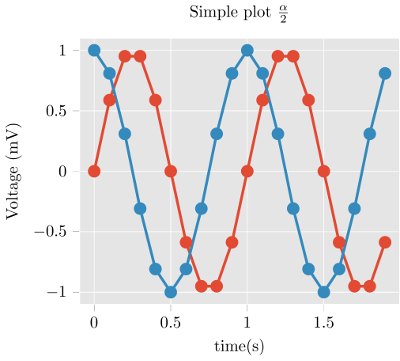
이것은 matplot2tikz로, matplotlib 그림을 PGFPlots (PGF/TikZ) 그림으로 변환하는 파이썬 도구입니다.
LaTeX 또는 ConTeXt 문서에 네이티브로 포함하기 위해 사용됩니다.
matplot2tikz의 출력은 PGFPlots으로, 이것은 PGF/TikZ 위에서 동작하는 TeX 라이브러리로, 축, 데이터 등과 같은 그래프를 설명합니다. 결과적으로 matplot2tikz의 출력은
- 더 많은 정보를 보존하며,
- 더 쉽게 이해할 수 있고,
- 더 쉽게 편집할 수 있습니다
import matplotlib.pyplot as plt
import numpy as npplt.style.use("ggplot")
t = np.arange(0.0, 2.0, 0.1)
s = np.sin(2 np.pi t)
s2 = np.cos(2 np.pi t)
plt.plot(t, s, "o-", lw=4.1)
plt.plot(t, s2, "o-", lw=4.1)
plt.xlabel("time (s)")
plt.ylabel("Voltage (mV)")
plt.title("Simple plot $\\frac{\\alpha}{2}$")
plt.grid(True)
import matplot2tikz
matplot2tikz.save("test.tex")
--> (see above) gives
\begin{tikzpicture}\definecolor{chocolate2267451}{RGB}{226,74,51}
\definecolor{dimgray85}{RGB}{85,85,85}
\definecolor{gainsboro229}{RGB}{229,229,229}
\definecolor{steelblue52138189}{RGB}{52,138,189}
\begin{axis}[
axis background/.style={fill=gainsboro229},
axis line style={white},
tick align=outside,
tick pos=left,
title={Simple plot \(\displaystyle \frac{\alpha}{2}\)},
x grid style={white},
xlabel=\textcolor{dimgray85}{time (s)},
xmajorgrids,
xmin=-0.095, xmax=1.995,
xtick style={color=dimgray85},
y grid style={white},
ylabel=\textcolor{dimgray85}{Voltage (mV)},
ymajorgrids,
ymin=-1.1, ymax=1.1,
ytick style={color=dimgray85}
]
\addplot [line width=1.64pt, chocolate2267451, mark=*, mark size=3, mark options={solid}]
table {%
0 0
% [...]
1.9 -0.587785252292473
};
\addplot [line width=1.64pt, steelblue52138189, mark=*, mark size=3, mark options={solid}]
table {%
0 1
% [...]
1.9 0.809016994374947
};
\end{axis}
\end{tikzpicture}
save() 대신 get_tikz_code()를 사용하면 코드를 문자열로 얻을 수 있습니다.)플롯 조정은 간단하며 TeX 작업 흐름의 일부로 수행할 수 있습니다. 훌륭한 PGFPlots 매뉴얼에는 플롯을 더욱 멋지게 만드는 방법에 대한 훌륭한 예제가 포함되어 있습니다.
물론, matplotlib로 생성된 모든 그림이 오류 없이 변환되는 것은 아닙니다. 특히, 3D 플롯은 작동하지 않습니다.
설치
matplot2tikz는 Python 패키지 인덱스에서 제공되므로, 간단히 다음을 실행하세요.
pip install matplot2tikz설치합니다.
사용법
- 평소와 같이 matplotlib 플롯을 생성합니다.
pyplot.show()대신에 matplot2tikz를 호출합니다.
python
    import matplot2tikz    matplot2tikz.save("mytikz.tex")
    # or
    matplot2tikz.save("mytikz.tex", flavor="context")
`
TikZ 파일을 mytikz.tex로 저장합니다.
mytikz.tex의 내용을 TeX 소스 코드에 추가합니다. 편리한 방법은
다음과 같습니다.
`latex
\input{/path/to/mytikz}
` 또한 PGFPlots 패키지와 적절한 유니코드 지원 패키지가
문서 헤더에 포함되어 있는지 확인하세요:
latex
    \usepackage[utf8]{inputenc}
    \usepackage{pgfplots}
    \DeclareUnicodeCharacter{2212}{−}
    \usepgfplotslibrary{groupplots,dateplot}
    \usetikzlibrary{patterns,shapes.arrows}
    \pgfplotsset{compat=newest}
` or:
latex
    \setupcolors[state=start]
    \usemodule[tikz]
    \usemodule[pgfplots]
    \usepgfplotslibrary[groupplots,dateplot]
    \usetikzlibrary[patterns,shapes.arrows]
    \pgfplotsset{compat=newest}
    \unexpanded\def\startgroupplot{\groupplot}
    \unexpanded\def\stopgroupplot{\endgroupplot}
`
코드는 다음 경로를 통해서도 얻을 수 있습니다:
`python
import matplot2tikz matplot2tikz.Flavors.latex.preamble()
# or
matplot2tikz.Flavors.context.preamble()
`
- [선택 사항]
clean_figure 명령어를 사용하여 tikz로 내보내기 전에 그림을 정리합니다.
`python
import matplotlib.pyplot as plt
import numpy as np # ... do your plotting
import matplot2tikz
matplot2tikz.clean_figure()
matplot2tikz.save("test.tex")
`
이 명령은 축 제한 밖에 있는 점들을 제거하고, 곡선을 단순화하며
지정된 대상 해상도에 맞게 점 밀도를 줄입니다.matplot2tikz vs. tikzplotlib
이 matplot2tikz 라이브러리는 tikzplotlib
프로젝트에서 시작되었습니다.
새로운 라이브러리가 만들어진 이유는 tikzplotlib이 더 이상 유지 관리되지 않고
유지 관리는 tikzplotlib 라이브러리의 단일 소유자만 할 수 있기 때문입니다.
만약 이미 tikzplotlib에 의존하는 서드파티 코드를 사용해야 한다면,
tikzplotlib 의존성을 matplot2tikz로 변경하는 것이 권장됩니다.
이것이 불가능한 경우, 우회 방법으로 서드파티 코드를 임포트하기 전에 다음 코드를 넣으십시오:
`
   import sys
   import matplot2tikz
   sys.modules["tikzplotlib"] = matplot2tikz
   # Do other imports, e.g., using
import my_third_party_library
# If tikzplotlib is used in this library, it will automatically use matplot2tikz instead.
`tikzplotlib에서 자신의 스크립트를 업데이트하는 경우, import 별칭을 사용하면 됩니다:
python
   import matplot2tikz as tikzplotlib
`
기여하기
버그가 발생하거나 기여하고 싶거나, matplot2tikz가 할 수 있는 멋진 예제가 있거나, 더 많은 정보를 찾고 있다면
matplot2tikz의 GitHub 페이지를 방문해 주세요.
기여하려면 다음 단계를 따르세요:
- git 저장소를 다운로드합니다. 예:
git clone git@github.com:ErwindeGelder/matplot2tikz.git.
- 가상 환경을 만듭니다. 예:
python -m venv venv.
가상 환경을 활성화합니다 (예: Windows에서는 venv\Scripts\activate).
uv를 pip install uv로 설치한 후, tox-uv를 uv pip install tox-uv로 설치합니다.
메인 브랜치는 보호되어 있어 직접 푸시할 수 없습니다.
따라서 변경 사항을 만들고 싶다면 별도의 브랜치에서 작업하세요. 예를 들어,
git checkout -b feature/my_awesome_new_feature로 새 브랜치를 만들 수 있습니다.
- 변경 사항을 푸시하기 전에 코드가 린팅 규칙을 준수하고 테스트가 성공하는지 확인하세요.
tox를 실행합니다. 이 명령은 린팅 검사와 모든 테스트 스크립트를 실행합니다.
수동으로 수행하려면 다음 명령을 사용하세요:
tox -e lint를 실행합니다. 수동으로 린팅 명령을 실행하려면:
(한 번만) uv pip install -r requirements-lint.txt
ruff format . --check (--check 플래그를 제거하면 ruff가 포맷팅을 수행합니다)
ruff check .
mypy .
tox -e py310 실행
tox -e py311 실행
tox -e py312 실행
tox -e py313 실행
tox -e py314 실행
tox -e combine-test-reports 실행
/reports/coverage_html/index.html에 있는 커버리지 리포트를 통해 테스트가 모든 부분을 커버하는지 확인하세요. 참고: 현재 모든 코드가 커버되는 것은 아닙니다. 이상적으로는 모든 코드가 커버되어야 하지만,
지금은 새로운 모든 코드가 테스트로 커버되는지 확인하세요.
- 변경 사항을 GitHub에 푸시하세요. 모든 것이 괜찮고
main 브랜치에 변경 사항을 병합하고 싶으면
풀 리퀘스트를 만드세요.
이상적으로는 병합 전에 최소한 한 명의 리뷰어가 풀 리퀘스트를 검토해야 합니다.
현재는 "코드 소유자(Code owners)"만
main` 브랜치에 풀 리퀘스트를 병합할 수 있습니다. 이는 모든 사람이 메인 코드를 (심지어 의도치 않게라도) 깨뜨리지 않도록 하기 위함입니다. "코드 소유자"가 되고 싶다면 알려주세요!라이선스
matplot2tikz는 MIT 라이선스 하에 배포됩니다.
--- Tranlated By Open Ai Tx | Last indexed: 2026-04-04 ---